
Many political scientists now recognize that Ross Perot’s independent candidacy did not spoil the 1992 presidential election for Republican President George H.W. Bush, yet few comprehensive quantitative analyses exist to prove such conventional wisdom correct.
While exit polls are by no means perfect measures of electoral preferences, they are often the best resources available for analyzing historical contests. We used the Voter Research Survey (VRS) exit polling data to quantify Perot’s true impact in the 1992 race for the White House while simultaneously examining the demographic composition of the presidential electorate.
Methodology Note
First, we filtered exit poll results for the following question: “If Ross Perot had not been on the ballot today, who would you have voted for?” which delineated Perot voters’ second choices in states where data was available (all except Alaska, Idaho, and Vermont). Respondents could choose between Clinton, Bush, or other. We excluded those voters who would not have voted had Perot not been a candidate.
Next, we quantitatively reallocated Perot’s actual raw votes by state into each of the four aforementioned categories based on corresponding exit poll vote distributions. This process allowed us to estimate how Clinton and Bush would have fared in a two-way contest.
Results Suggest Ross Perot Did Not Spoil President Bush’s Reelection
Aligning with modern interpretations of the election, our VRS analysis quantitatively confirms that Perot did not spoil President Bush’s reelection. In fact, returns suggest that, overall, Perot voters actually would have preferred Clinton over Bush.
Of responding Perot voters surveyed by VRS, 51% preferred Clinton as a second choice compared to 42% for Bush. A combined 7% would have supported other candidates or refrained from voting altogether. Using the 47 states with available data, then, we find Clinton would have won the popular vote 53–46% ― a 7-point margin not too dissimilar from the former Arkansas Governor’s actual 5.5-point win.
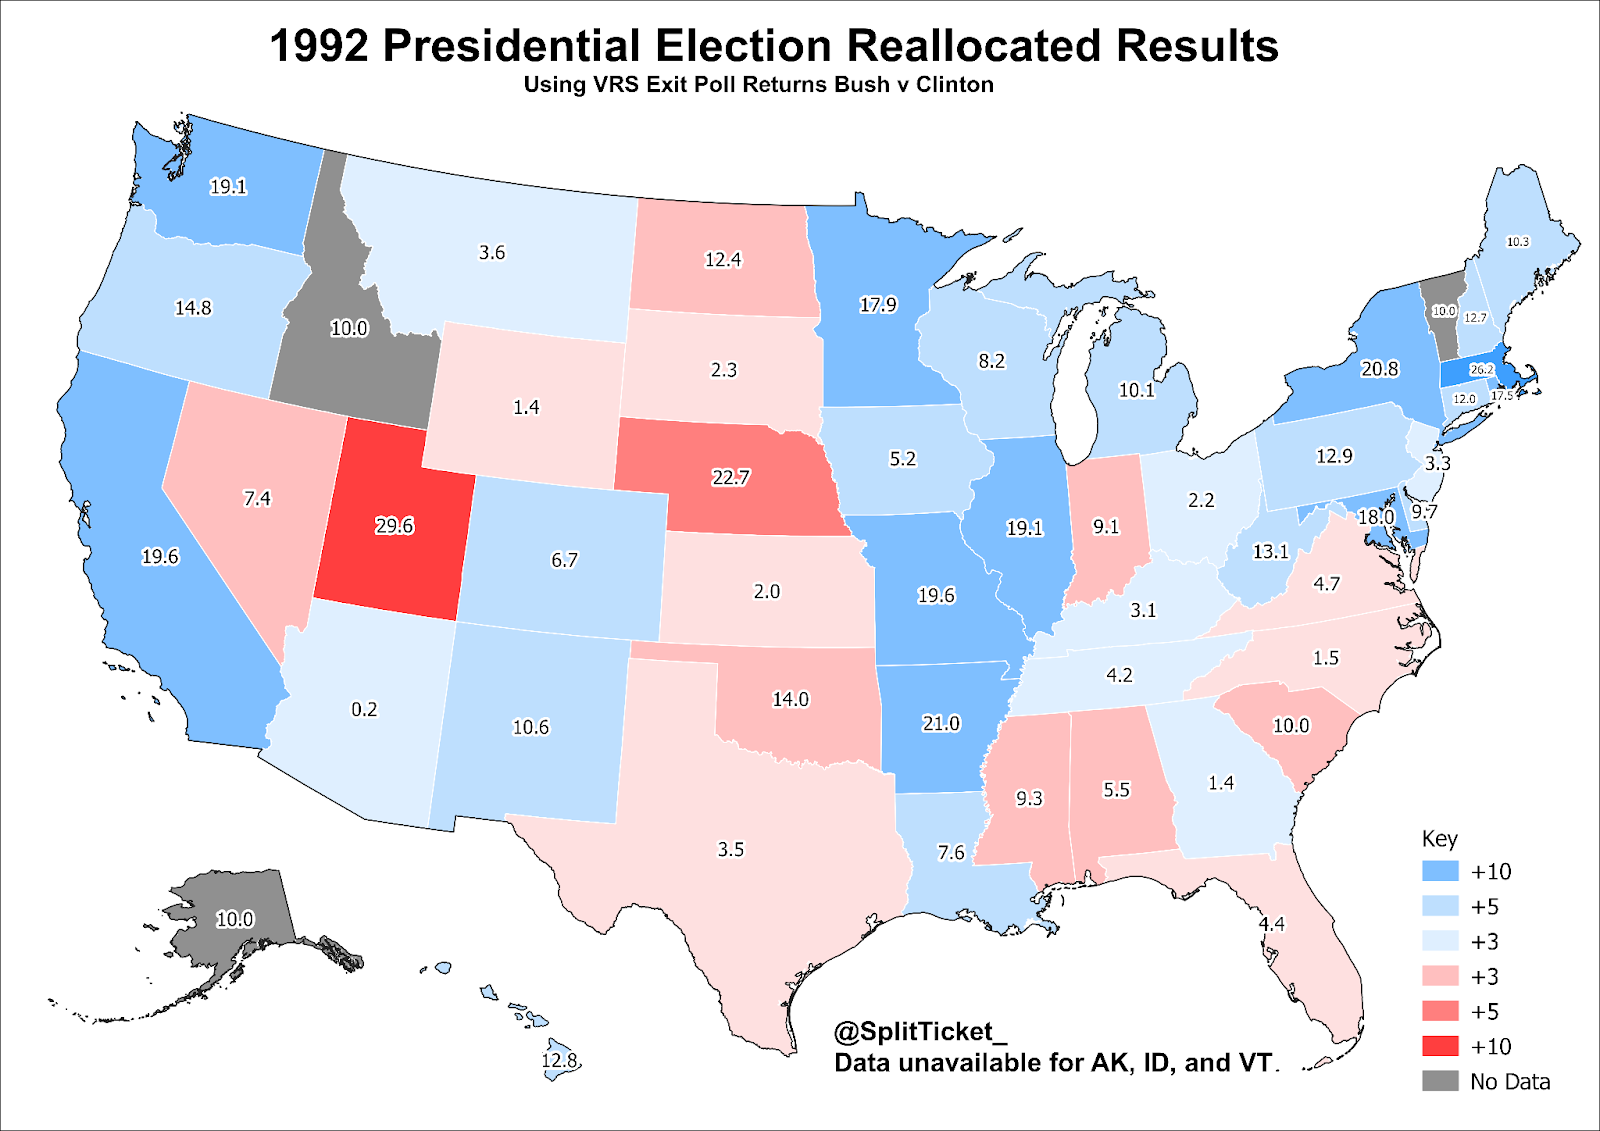
Similar findings are borne out on the reallocated electoral map, on which Clinton would have won in a landslide both with and without Perot. While applying the exit poll calculations to the general election results did shift the needle significantly in some states (e.g., New Hampshire’s Perot voters breaking heavily for Clinton against Bush, whereas Utah’s did the opposite) movement was generally constrained, with an average shift of about D+2.
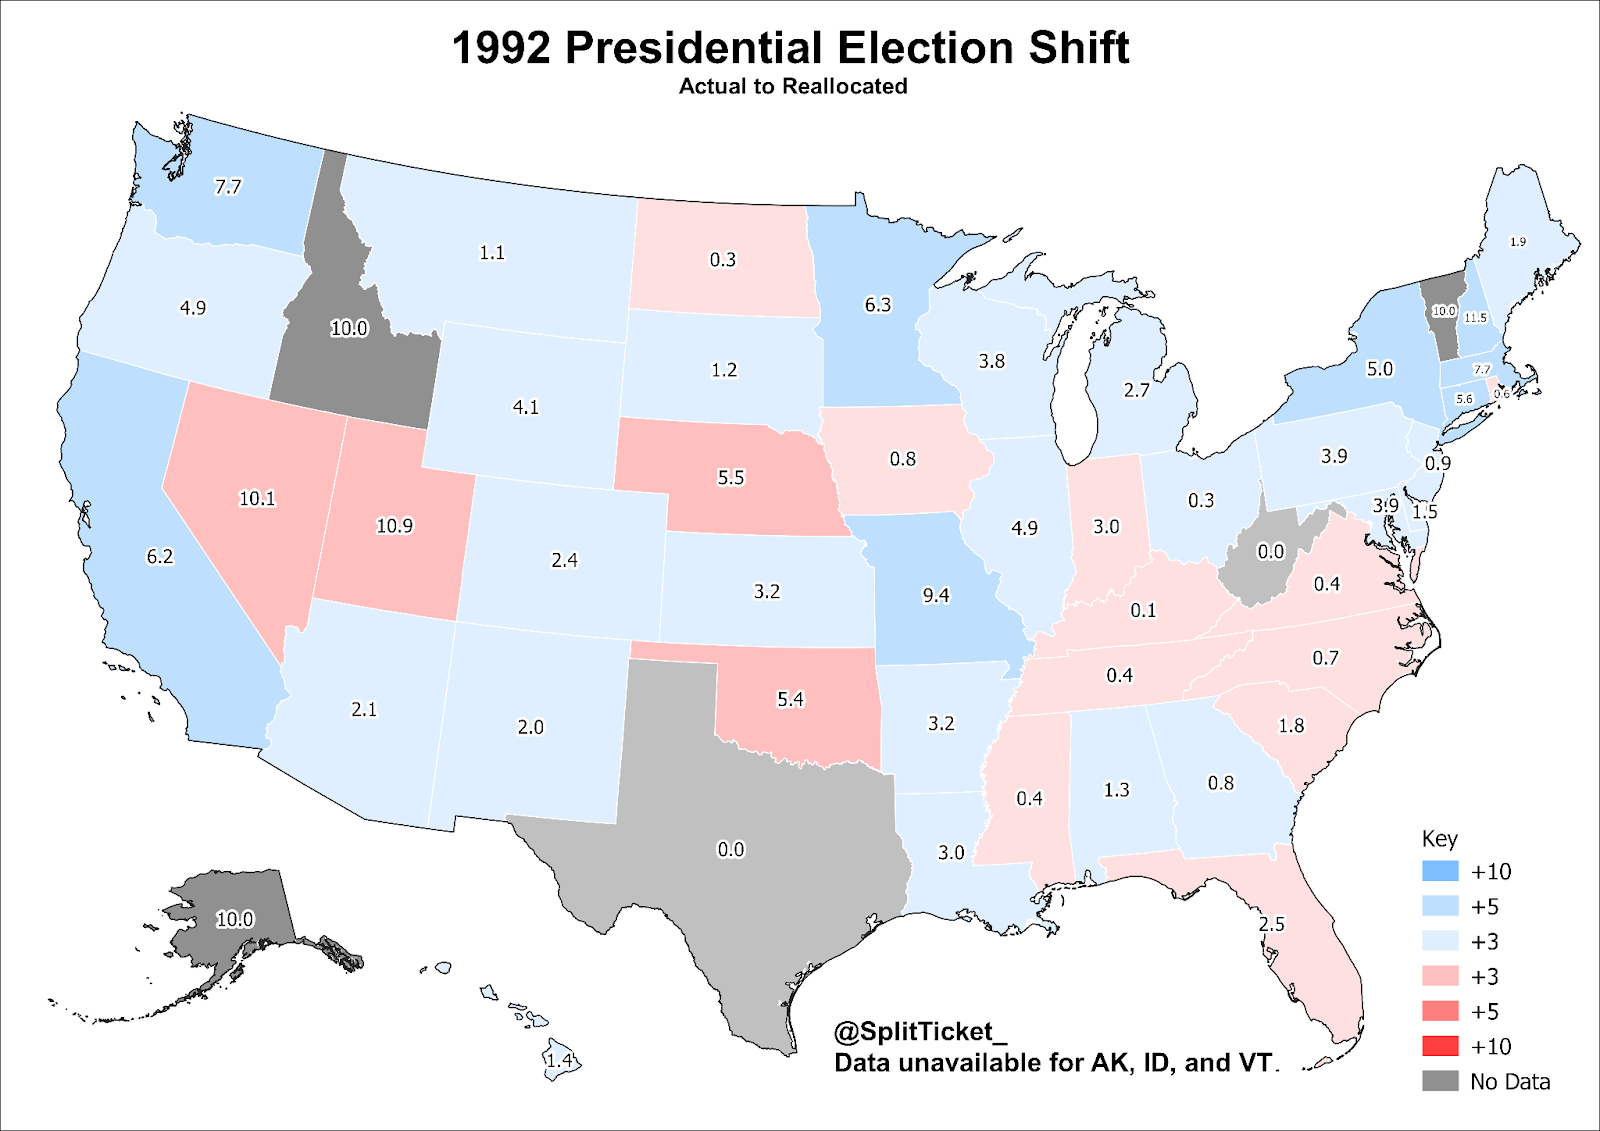
Only two states on the electoral map would have changed hands following reallocation: Arizona (8) to Clinton and Nevada (4) to Bush ― a net loss of 4 electoral votes for Bush among the states with available data. In the Grand Canyon State, Perot voters voted slightly more Democratic than the national average. Nearly 6%, however, would have stayed home or supported another candidate had Perot not been on the ballot. Bush had won the state by roughly 2 points.
Surveyed Perot voters in the Silver State, meanwhile, behaved similarly to those in nearby Utah ― breaking comfortably for Bush. That’s hardly surprising considering Nevada had a fairly consistent record of backing Republican presidential candidates and a whopping 14% of Perot voters would not have supported Bush or Clinton in a head-to-head election, more than in any other state. Clinton had won the state with a 2.6-point margin.
The 1992 Presidential Electorate: A Demographic Analysis
Estimating Perot’s impact on the 1992 presidential election merely scratches to the surface. To fully understand the actual results and the Texas businessman’s coalition, we must examine the surveyed electorate by age, race, and gender.
Keep in mind also that the general polarization among these groups in 1992 seems mild today. Perot’s base was primarily young, white, and male, but his appeal was ultimately broader than first meets the eye.
Age

Clinton predictably performed best with voters over 60 and those under 25. The Silent Generation’s austerity during World War II and its general reliance on New Deal-era entitlement programs like Social Security made it more Democratic than the national average.
1992 also marked young voters’ (18–24) emergence as a reliable part of the Democratic coalition. Bush, meanwhile, retained steady support across all age groups, but peaked among voters aged 45–60. Unsurprisingly, Baby Boomers (40–44) supported the similarly-aged Clinton more strongly (47-33%) than any other middle-aged demographic.
Perot drew most of his support from the younger elements of Generation X (25–29), which can be partially explained by youth disillusionment with the status quo of the two-party system.
Gender
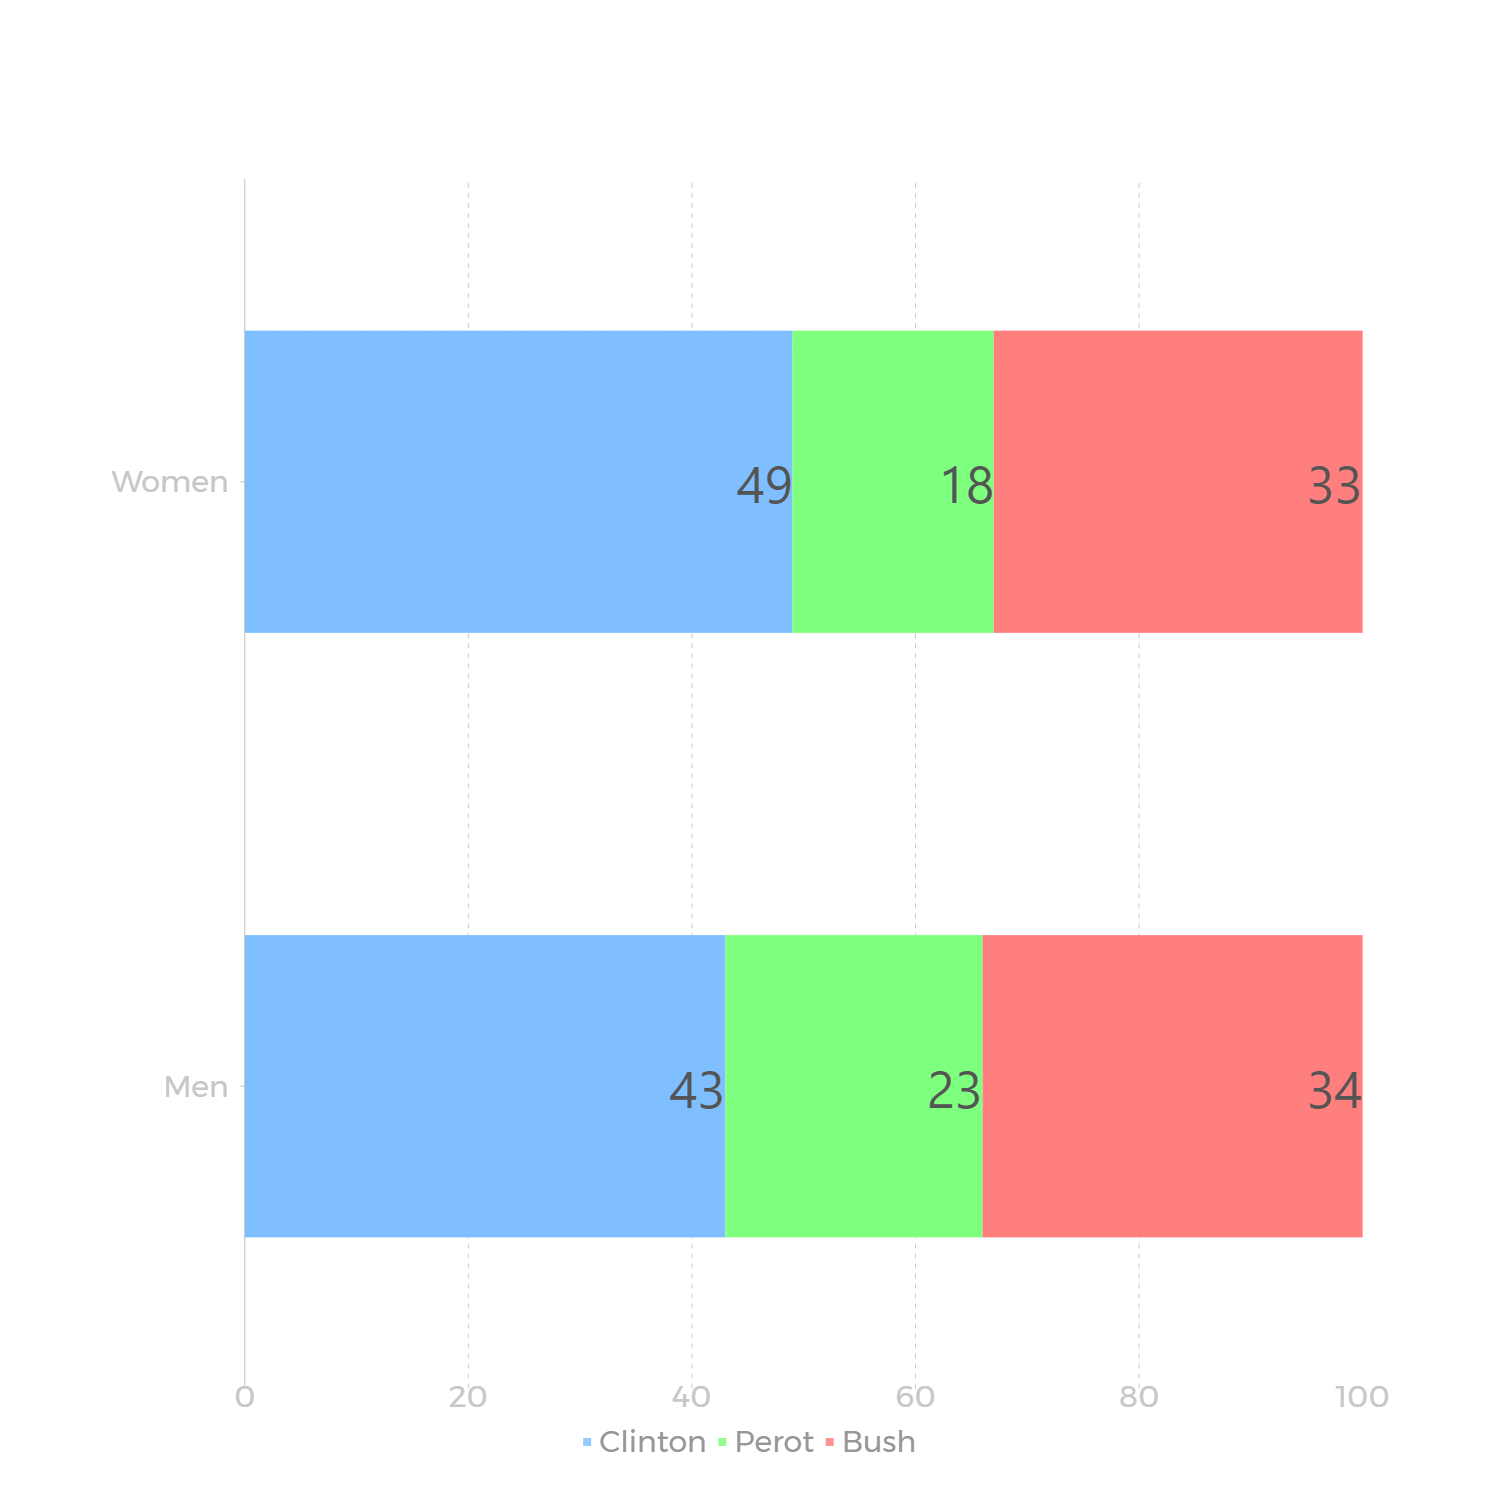
A standard gender gap was observable in the 1992 presidential election, but women were much less Democratic relative to the nation than they have been in the years since. Clinton won both men (9 points) and women (15 points), but took a majority with neither demographic since Perot earned roughly 1 out of every 5 votes across the board. While the Texas businessman’s support was slightly more pronounced among men, the 4-point delta is comparatively small and signifies relatively broad appeal.
Race
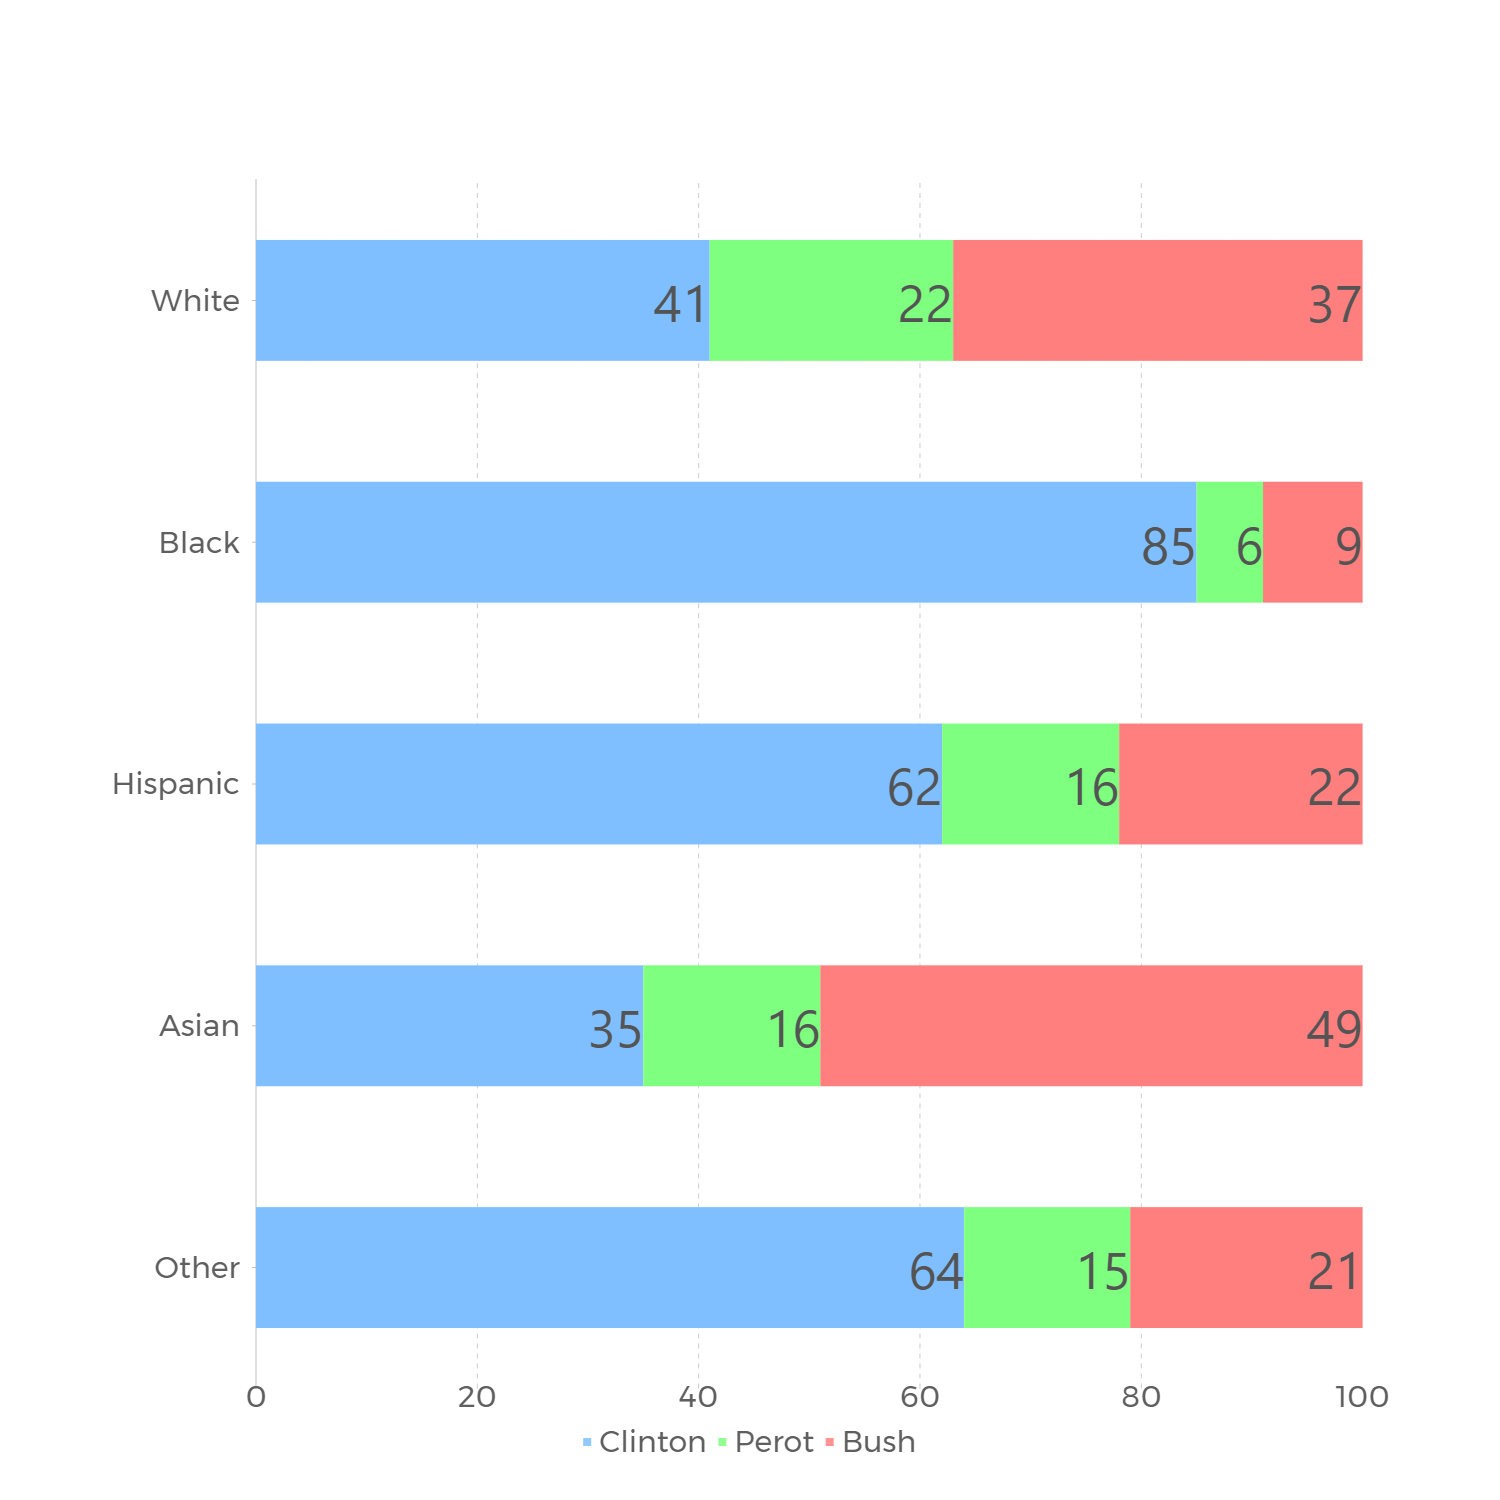
Perot’s appeal was mostly uniform among different racial groups. He performed strongest with white voters, winning 22% of the demographic, while taking 16% of both the Latino and Asian votes in the VRS exit poll.
He struggled predictably with black voters, of whom only 6% surveyed backed Perot. Because the 1992 electorate was significantly whiter than today’s, the white composition of the electorate tracks closer with the overall numbers ― Clinton won whites by 4. Latinos joined blacks in breaking solidly for Clinton while Asians stuck with Bush.
In typical Democratic fashion, Clinton assembled the more racially diverse coalition. 19% of his supporters were black, compared to just 3% for both Bush and Perot. Latino voters also held far less electoral influence than they do today. They strongly backed Clinton but only composed 4% of his coalition. 75% of Clinton’s supporters were white compared to 93% for Bush and Perot, indicating a similar geographic profile between the latter two candidates’ coalitions.
What’s Next For Our VRS Analyses?
Next weekend, we’ll extend our 1992 VRS analysis by examining the impact of surveyed voters who would have voted for Perot had they thought that he had a chance to win. Doing so will allow us to estimate Perot’s adjusted maximum ceiling by state, providing insight into how Perot might have done had he not suspended his campaign during the summer months ― when, at one point, he led both Clinton and Bush in national polls. Our primary question is as follows: could these voters have forced the presidential race into the House of Representatives?
Notes & Sources
ABC News/CBS News/CNN/NBC News. Voter Research and Surveys: National Election Day Exit Poll, 1992, 1992 [Dataset]. Roper #31098701, Version 4. Voter Research & Surveys [producer]. Cornell University, Ithaca, NY: Roper Center for Public Opinion Research [distributor]. doi:10.25940/ROPER-31098701
Using Voter Research Survey (VRS) Exit Polling Data
My name is Harrison Lavelle and I am a co-founder and partner at Split Ticket. I write about a variety of electoral topics and handle our Datawrapper visuals.
Contact me at @HWLavelleMaps or harrison@splitticket.org
I’m a political analyst here at Split Ticket, where I handle the coverage of our Senate races. I graduated from Yale in 2021 with a degree in Statistics and Data Science. I’m interested in finance, education, and electoral data – and make plenty of models and maps in my free time.