Now more than ever, political observers seem to be digging into polls’ crosstabs, oftentimes reacting with incredulity at some of the results among certain demographic subgroups. Sometimes they’ll even point to these seemingly impossible subgroup margins (e.g., “There’s just no way Trump is leading Biden among white college graduates!”) as a reason to disregard the poll’s results — and sometimes the pollster itself — entirely.
At the same time, more and more political journalists (and even some pollsters themselves) seem to be focusing their polling analysis on crosstab subgroup results almost as though they’re near-gospel.
What both of these groups fail to realize is that individual crosstabs are often very noisy. By design, breaking out survey results into subgroups results in smaller sample sizes, and thus larger margins of sampling error. For example, in the latest national Quinnipiac University poll the total sample size among registered voters is n=1,574, which would have a margin of sampling error of ±2.5%. However, if you’re just looking at results among Hispanic voters, which have a sample size of n=104, the margin of sampling error jumps to ±9.6%.
And as a reminder, margins of error apply to each number in both directions. The crosstabs from this Quinnipiac poll show Biden leading Trump 49% to 43% among Hispanic voters. With the above margin of error, Biden’s support falls within the range of 39% to 59%, while Trump’s falls within the range of 33% to 53%. These ranges are massive and overlap to such an extent that confidently drawing horse race conclusions from them becomes questionable.
Crosstabs from individual polls — which as a reminder, are snapshots in time, and are not necessarily predictive this far out from the election — are better signals of directional insights into subgroups’ vote preferences.
What Recent Crosstabs Are Telling Us About 2024
The crosstabs of many recent national and swing state polls of the 2024 general election have been suggesting potentially seismic shifts in existing electoral coalitions — most notably that younger voters and voters of color may be abandoning the Democratic Party en masse.
This has inspired a spirited debate regarding how confident we should be in these numbers, especially from just under a year out from the election.
There are essentially two schools of thought here:
Group #1: Those who are more inclined to believe that recent polling showing Biden hemorrhaging support among young voters and voters of color are an early warning sign that 2024 could be a realigning election.
They also hold that lower propensity/less engaged voters from these groups are much more likely to vote for Trump/Republicans than those that have been turning out and supporting Democrats — sometimes by historically wide margins — in post-Dobbs elections.
Group #2: Those who are more skeptical that recent polls are accurately capturing the sentiment of the American electorate.
They cite the potential of:
- Measurement error (e.g., differential partisan non-response for harder-to-reach groups like young voters and voters of color)
- Unintended effects of recent methodological changes (e.g., weighting on recalled 2020 vote)
- Disengaged voters using their responses to these polls to express their frustration with Biden, the incumbent, rather than thinking about the 2024 election as a binary choice this far out from the election.
Introducing the 2024 General Election Crosstab Aggregator
One claim that came out of this debate, from the New York Times’ Nate Cohn, is that while individual crosstabs are often noisy, aggregated crosstabs (across multiple polls) with large sample sizes and smaller margins of error are largely accurate.
Unfortunately, most pollsters either don’t aggregate their crosstabs or don’t release them publicly. Additionally, while there are many aggregators of topline polling results, there aren’t any known aggregators of crosstab results (at least, to our knowledge).
So, I thought I’d give it a shot.
Over the past few weeks, I’ve put together an aggregate of subgroup margins from crosstabs of national 2024 general election polls conducted in November 2023. I will be repeating this exercise once a month through the end of October 2024 so we can track how subgroups are shifting over the course of the campaign.
Here’s how it works:
- I take a flat average1 of the results of every subgroup from every qualifying poll2. I only include subgroups when they appear in 2+ qualifying polls in a given month.
- For 2020 baselines, I take a flat average of the results of every available subgroup from the most widely respected estimates3 of the 2020 election – Catalist, Pew Research’s validated voter analysis, and AP VoteCast – and compare that to the polling average.
- For polls of a 3+ candidate race, I’ll only be tracking polls that include candidates that have actually announced prior to when the poll was launched.
I’ll be the first to admit this is an imperfect tool. There’s a reason most haven’t attempted to put this together: it’s really messy and very, very difficult to do.
Pollsters have different methodologies, data collection methods, sampling methods, approaches to weighting, question wording, etc. There’s no perfect way to select the polls to include (though I did my best to be rigorous with the criteria). I could go on. But the goal of publishing this aggregator isn’t to create a perfect tool. Nor is it to speculate on whether the current polls are “right” or “wrong.”
It’s to provide an estimated snapshot of where national polls think the race stands among various subgroups — with much larger sample sizes than individual polls — on a monthly basis so we can examine them at-a-glance (compared to 2020 estimates) and track them over time. And, of course, to test the hypothesis that aggregated crosstabs are generally accurate.
Subgroup Polling Averages from November 2023 Polls
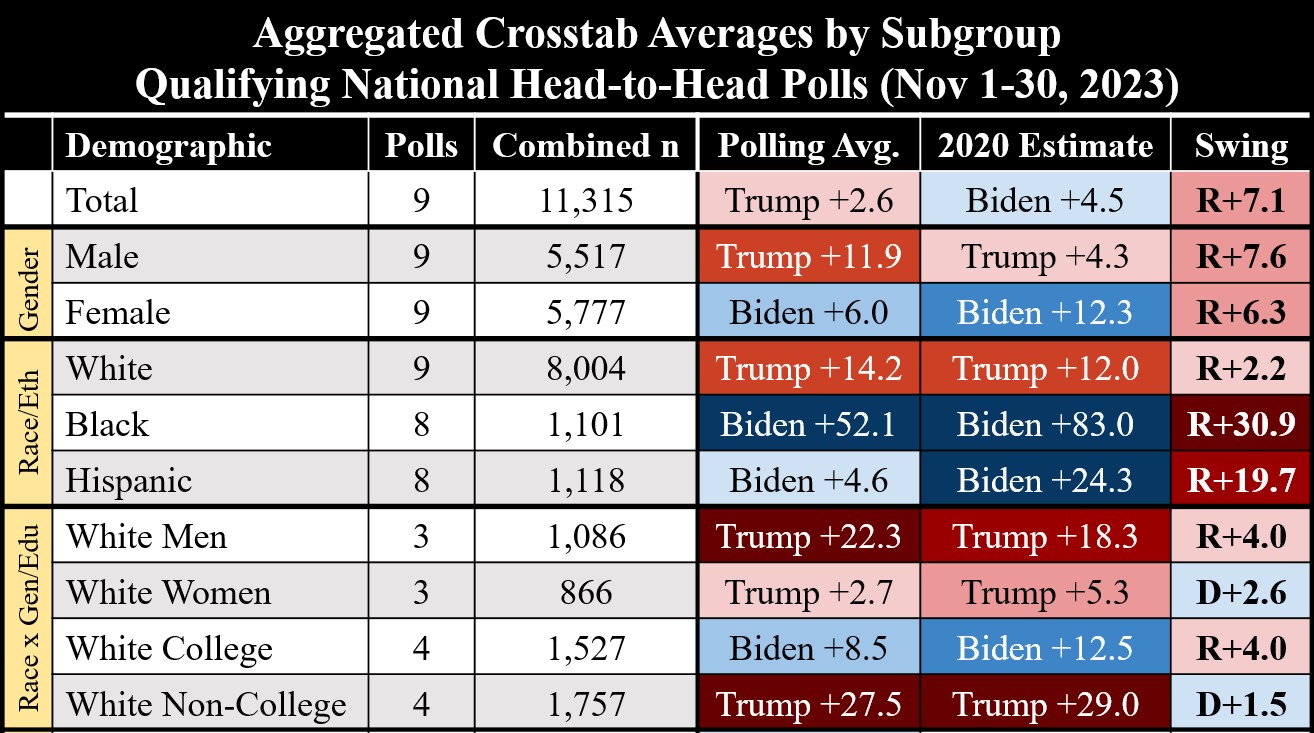
Without further ado, let’s dig into the aggregated results from November 2023 national polls4:


Overall, Trump leads Biden by 2.6 points across nine polls conducted in November. In 2020, Biden won the national popular vote by 4.5 points, so the polling average implies a shift of 7.1 points to the right.
Below I’ll be digging into some of the subgroups where crosstab aggregates are showing particularly large shifts relative to 2020.
Race, Ethnicity, and Crosstabs
National polls show Trump outperforming his 2020 numbers among Black voters by 31 points and among Latino voters by 20 points.

Black Voters
This would represent the strongest Republican performance among Black voters in at least 50 years. Per exit polls, the average two-party shift in margin among Black voters from cycle to cycle since 1972 has been ~6%. The largest shift during that period was from 2004 to 2008, where Black voters swung to Democrats by a ~14-point margin.
For what it’s worth, aggregated crosstabs from high quality pre-election polls in 2022, 2020, and 2016 have consistently underestimated Democrats’ vote share about Black voters. And while Democrats may be slowly losing ground with Black voters, there seems to be little electoral evidence of sudden and massive slippage among this group — the 2022 midterms showed Democrats getting roughly 90% of the Black vote, and Brandon Presley just won Black voters by ~94 points in the Mississippi gubernatorial race.
Latino Voters
This would also represent the strongest Republican performance among Latino voters in at least 50 years, though George W. Bush only lost Latino voters by ~10% of the two-party vote in 2004. Per exit polls, the average two-party shift in margin among Latino voters from cycle to cycle since 1972 has been ~12%. There have been two single-election marginal shifts larger than 20 points – from 1996-2000 and from 2004-2008.
Age
National polls show Trump outperforming his 2020 numbers among young voters, and Biden narrowly outperforming his 2020 numbers among senior citizens.

Some pollsters group/define young voters as age 18–29 and some as age 18–34. This may seem like a trivial difference, but the polling margins are, surprisingly, drastically different for these two groups.
Polls that use the 18–29 age grouping in their crosstabs find Biden leading Trump by ~16 points, which would represent a 8-point rightward shift from 2020 — about in line with the national shift. However, it’s likely that much of that has to do with YouGov — which conducted three polls in November for different sponsors — generally showing Biden performing more strongly among young voters than other pollsters.
Polls that use the 18–34 age grouping in their crosstabs find Biden leading Trump by a much narrower ~3-points margin. These are the polls that have been getting so much attention in the media and on social media. Unfortunately the 2020 estimates all use the age 18–29 grouping and not 18–34, so we don’t have a direct way to compare it to 2020 estimates, but we can estimate that this would be a ~15–20-point rightward shift from 2020 — and the strongest Republican performance among young voters since 2000.
How can these titanic, pro-Republican polling shifts be reconciled with the close margins shown in national surveys? The answer can be found in Democratic performance with seniors in polling — November polls also show Trump only leading Biden by ~1 point among voters aged 65+, which would represent a leftward shift of ~2 points from 2020.
Party ID & Ideology
National polls show Trump outperforming his 2020 numbers among self-identified independents and moderates by double-digit margins.

Among independents including partisan leaners, polls show Trump leading Biden by ~6 points, which would be a rightward shift of ~15 points from 2020.
Among self-described moderates, polls show Biden leading Trump by ~14-points, which would be a rightward shift of ~12 points from 2020. Perhaps unsurprisingly, moderates tend to be more elastic than many other subgroups, so this shift would be far from unprecedented.
Population Density
National polls show Trump outperforming his 2020 numbers among urban voters by 21 points, and Biden outperforming his 2020 number among rural voters by 9 points.

November polls show Biden leading Trump by ~20 points among voters living in urban areas, which would be a 17-point rightward shift from 2020. This is slightly less than the rightward shifts national polls are showing among Black and Latino voters, which makes sense given that progressive white voters — who live disproportionately in cities — are more likely to stand by the President.
But something that’s flown under the radar is that national polls are showing Biden gaining ground (12 points) among rural voters relative to 2020.
A Note on a Multi-Candidate Race
National polls featuring Robert F. Kennedy Jr. show him winning a remarkably consistent share of the vote across subgroups.

I could easily write a whole separate post on how all-over-the-place the numbers are in polls that test Biden vs. Trump vs. Kennedy vs. other candidates (usually West and/or Stein)5.
But one thing that strikes me in particular is just how consistent and uniform Kennedy’s support is among most demographic groups. With the exception of voters aged 18–34 and 35–49 (where his support is higher), he currently pulls between 13-18% among every demographic subgroup across gender, race/ethnicity, race by gender, race by education, and age group.
That is remarkable. So remarkable, in fact, that it seems improbable. Typically, third party candidates — even successful ones like Ross Perot —still have groups with which they are particularly strong or particularly weak. The fact that Kennedy’s polling is so evenly distributed among subgroups suggests to me that voters don’t know much about him, and that he’s serving as a de facto protest candidate for the (many) voters that are upset with the choice of Biden vs. Trump.
This becomes clear if you dig into the ideological and partisan splits, where his relatively high support levels with moderates and independents tell us that he appeals the most to disaffected voters (although he still pulls a remarkably consistent set of shares here too).

If (and probably when) Kennedy’s support begins to drop as voters learn more about him, and as major parties begin to turn their fire toward him in earnest, we’ll be here to track how his coalition shifts, and which major party candidate he ends up hurting more.
Takeaways
The polls from November 2023 are showing major (and sometimes unprecedented) coalition shifts relative to 2020 estimates — particularly among Black voters, Latino voters, younger voters, independents, moderates, and urban voters.
There have been major demographic shifts before, such as 1976, 1984, 2000, and 2008, which all featured some sort of major realignment, so the possibility shouldn’t be dismissed out of hand. And I don’t deny that Biden is at risk of slipping a bit among most or all of these groups, some of whom may go to Trump, third party candidates, or their couch. However, my priors make me skeptical that 2024 will be a major realignment election:
- It’s likely to be a rematch election in which both candidates are not only nearly universally known but also widely disliked, so there’s likely little that can change voters’ views of them (though a Trump conviction or a major medical episode could shake things up).
- Polls a year out from the election are just plain noisy. The campaign hasn’t really started, billions of dollars have yet to be spent, we don’t have formal nominees, voters aren’t really playing close attention to the race, Trump has been out of the news (by his standards), and voters may be engaging in expressive voting against Biden rather than viewing the race as a binary choice.
- We haven’t seen almost anything in the post-Dobbs election results that presages major coalitional shifts like we saw among Hispanics in 2018, when we saw Democrats perform poorly in the Rio Grande Valley and South Florida. If anything, Democrats have faced turnout challenges among young voters/voters of color, not persuasion challenges.
- Partisan differential non-response, recent subgroup polling misses, and recent methodological changes in polling are things we should take seriously (though they don’t explain everything).
Again, these are merely my priors. Many of these could end up being wrong, and only time will tell.
But I think that it’s healthy and appropriate to express at least some skepticism of those that are currently highly confident that these massive shifts are real. It’s perfectly fine to embrace uncertainty and wait for the campaign — especially one as unusual as this one — to play out before drawing any definitive conclusions. 336 days is an eternity in electoral politics.
Until then, we’ll be here to track the national general election polls in December and beyond to monitor movement among these groups.
Adam Carlson has over a decade of experience working in political polling and market research. His crosstab aggregation for the 2024 election can be found here.
- I tested a version of this using a weighted average based on sample size, and the results weren’t markedly different. So I am sticking with a flat average for the sake of simplicity. ↩︎
- In the interest of full transparency, here’s the criteria for which polls I’ll be including in this aggregator — national 2024 general election polls:
– Conducted among registered voters or likely voters
– With an out-of-field date between November 1-30 (or whatever month we are examining at the time)
– With a total sample size of n=800 or higher
– Conducted by either non-partisan affiliated pollsters or two partisan pollsters (one Democratic-affiliated, one Republican-affiliated) collaborating
– That have a B- pollster rating from FiveThirtyEight or higher or meet AAPOR/Roper’s transparency standard
– That have crosstabs that are publicly accessible and free of charge
– That have no known instances of methodological impropriety or seemingly intentional skewing of results (e.g., leading question wording)
– If qualifying pollster polls more than once in a window for the same sponsor, only the most recent poll of the agency/sponsor pair is taken, so as to reduce the influence of trackers and not double-count them. But if a qualifying pollster polls for different sponsors within a window, they are all included. ↩︎ - I excluded the Edison Research exit polls from this average; they are far less reliable/precise than these estimates, though they do have some value in examining longitudinal data by subgroup.
↩︎ - Polls included in November 2023 aggregate (per criteria above): The Economist (YouGov) – 11/25-27, Emerson College – 11/17-20, NBC News (Hart/Public Opinion Strategies) – 11/10/-14, Fox News (Beacon/Shaw) – 11/10-13, Yahoo! News (YouGov) – 11/9-13, Quinnipiac University – 11/9-13, Marquette Law School – 11/2-7, CBS News (YouGov) – 10/30-11/3, CNN (SSRS) – 10/27-11/2
↩︎ - Polls included in November 2023 aggregate (per criteria above): Fox News (Beacon/Shaw) – 11/10-13, Quinnipiac University – 11/9-13, CNN (SSRS) – 10/27-11/2, Emerson College – 11/17-20 ↩︎
Adam Carlson has over a decade of experience working in political polling and market research