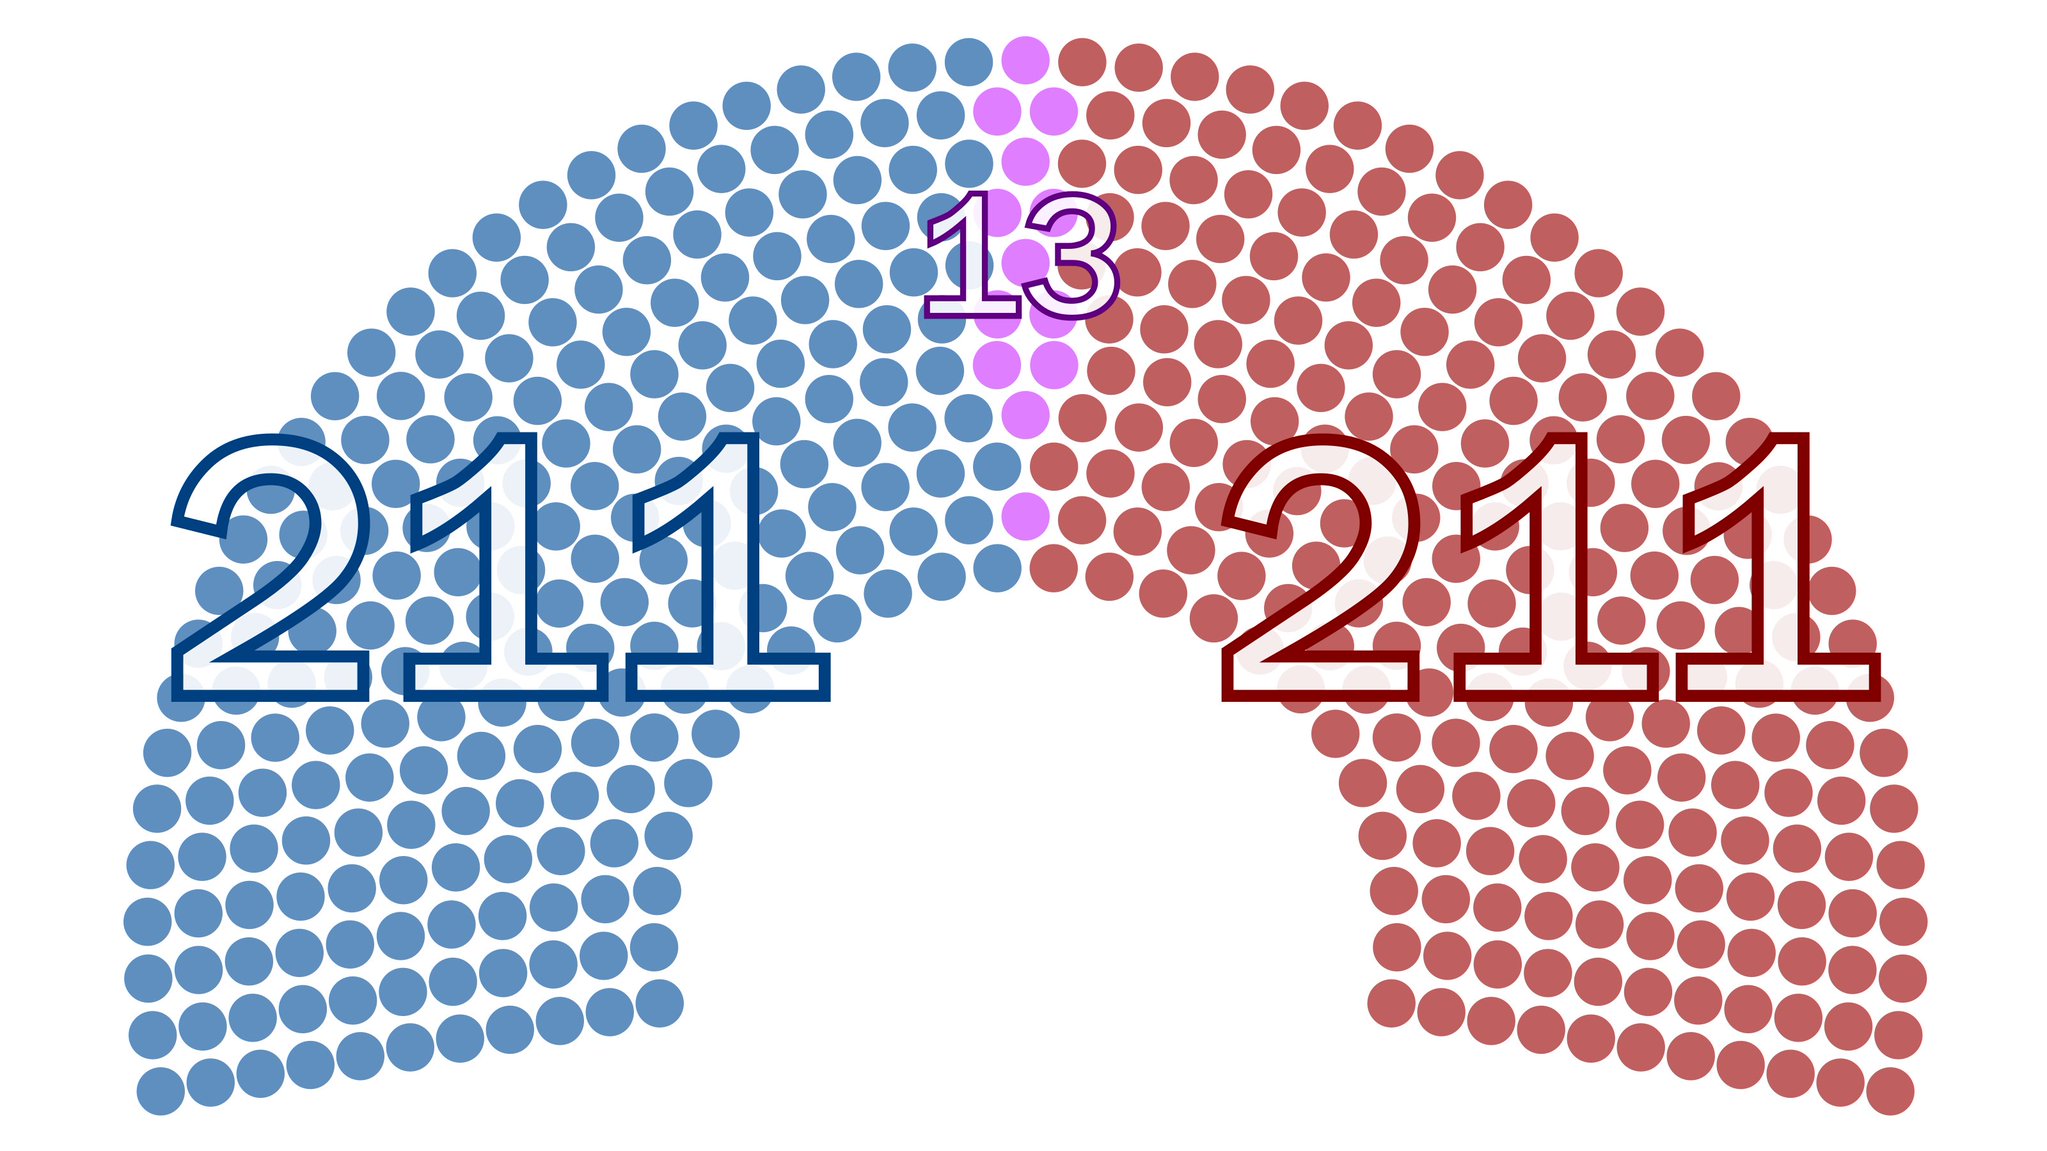
The 2024 House playing field has changed significantly since our previous official ratings update in September. In our last update, 210 seats favored Democrats and 203 favored Republicans, while the remaining 22 seats were tossups. In this iteration, however, both parties are favored in 211 seats, with 13 tossups.
Our new model gives Republicans a 56% chance of retaining the House, and the Democrats a 44% chance of retaking it, reflecting a dead heat for the chamber. Our seat-by-seat probabilities can be found here (or here).

Broadly, this change is driven by two main factors. The biggest one is that this is a significantly more Republican environment (at both the presidential and congressional levels) than we had anticipated late last year. The broad gains we expected Biden to make with independents and core elements of his base simply have not materialized, and while they still may, it is unwise to continue basing our ratings on such an assumption.
This is also a large part of the reason that races like MI-10 and VA-02 shifted significantly to the right in this update; simply put, in an environment where Trump leads in Michigan by a point, or is actually keeping Virginia within 6, Democrats would face a steep, uphill battle to unseat well-funded GOP incumbents in seats that Biden would likely lose. While we do expect many of these ratings to shift towards Democrats as time goes on, the onus is on them to recruit and fund credible challengers that can win in potentially difficult environments, like the one they may find themselves in right now.
There is always the possibility that recent events (such as Donald Trump’s conviction) can meaningfully change the political environment. But we are comfortable releasing this model at this time; any future detected changes in environment can and will be accounted for in our next update, which we anticipate releasing next month.
The second major factor driving these changes is that this is our first update implementing a numerical model to determine quantitative estimates of the most probable outcomes — previously, our ratings were derived based on our personal assessments of districts (similar to how agencies like the Cook Political Report, Inside Elections, and Sabato’s Crystal Ball do it). Our model utilizes factors like district partisanship, prior overperformance, fundraising, incumbency, and polling (sourced from Race To The White House) to create per-district estimates.
In an effort to make the model outputs more understandable, we’ve bucketed them into familiar groups. As mentioned above, you can find the current seat-by-seat probabilities here.

Note that as with any quantitative model, some seats simply lie on the edge — for example, April McClain-Delaney has a 79% chance of winning her election in Maryland’s 6th district, while Chris DeLuzio has an 80% chance in Pennsylvania’s 17th. Functionally, there is no difference between those probabilities, but McClain-Delaney’s win probability puts her race into the Leans Democratic bucket, while DeLuzio’s goes into Likely. Remember that the probabilities are the “real” forecasts; these ratings are simply helpful buckets for aggregators and casual readers alike.
Below is a complete list of changes from our old forecast, as we transition to a numerical model instead. We stress that these ratings are fluid and will change over time, especially as more fundraising data trickles in and the campaigns accelerate.

Redistricting
Over the past six months, five states have redrawn their congressional maps, for a total of 67 redrawn districts. Two of these were partisan-led redraws, while three were the result of court enforcement of the Voting Rights Act. However, most redrawn districts did not meaningfully change their partisanship.
In Georgia, for example, a court ordered the state to draw an additional majority-Black district. While the legislature acquiesced to this order, it did not end up creating an additional Democratic seat. Consequently, the Georgia congressional map retains its previous partisanship.
Similarly, elsewhere in the Deep South, Louisiana and Alabama were forced by courts to draw an additional VRA seat for African-American voters, splitting up two Republican-drawn packed districts into four more spread out districts. This massively redistributed the makeup of some districts, but can be best described as Barry Moore’s AL-02 and Garret Graves’ LA-06 being remade into Democratic-leaning Black VRA districts. Incidentally, Moore was able to unseat Jerry Carl for the primary election in AL-01, effectively allowing the displaced Republican congressman to push out his colleague and remain in the chamber.
In North Carolina, the Republican supermajority in the legislature redrew a commission-drawn map to flip three seats beyond Democratic hopes of victory. By tracking incumbent refiling and population exchange, the “new” Republican seats can be identified as NC-06, NC-13 and NC-14, displacing Democratic representatives Kathy Manning, Wiley Nickel, and Jeff Jackson.
New York’s congressional map drew much fanfare, with many speculating that Democrats would go for a maximally-advantageous redraw that would put several Republican incumbents in very Democratic districts. In the end, however, only Brandon Williams’ NY-22 got meaningfully bluer, moving from Biden +7 to Biden +11 (which shifts the district’s rating from Tossup to Leans Democratic). Tom Suozzi also received a boost in NY-03, as redistricting gave him a Biden +11 seat, an improvement on its previous Biden +8 incarnation.
Entering the Tossup Column
Four congressional districts are entering the tossup column, adding to nine existing tossup races for a total of thirteen. First is Alaska’s at-large seat, held by Democrat Mary Peltola. While Peltola has remained popular, renewed efforts from national Republicans in a presidential year with new Republican-leaning voters will give her her toughest test yet.
Next up is ME-02, based in the state’s rural north. Republicans expect Trump’s strong appeal in lower-college attainment and rural areas like ME-02 to help State Rep. Austin Theriault, a star recruit, and give Rep. Jared Golden a run for his money. While our model still favors Golden, we do expect this to be his closest race yet.
Next up is NC-01. Originally solidly Democratic and a black VRA-mandated seat, the district has been redrawn to favor Republicans more, with Biden having won the current incarnation by less than 3 points in 2020. Incumbent Rep. Don Davis is a well-known moderate, but racial polarization and slippage with rural moderate and conservative black voters could tip this race to Republicans, and the model currently views it as a dead heat.
Finally, MI-08, centered on the working-class cities of Flint, Saginaw, and Bay City, is seeing an open race after popular incumbent Dan Kildee is retiring. Much of the Democratic base is locked up in those three blue-collar cities. All of these seats are concentrated in red-leaning or right-trending areas, and retaining this district may be troublesome for Democrats, especially without Kildee’s strength.
Leaving the Tossup Column
Most of our ratings changes are taking place in seats that are leaving the tossup column. A total of thirteen seats fall into this category, all of which are represented by Republicans. Ten of these districts voted for Biden in 2020, making them some of the most vulnerable Republican-held seats going in November. Only three districts moving out of the tossup column voted for Trump four years ago.
We begin with the Republican-held crossover districts shifting to Leans Republican. These are AZ-06, CA-45, and NJ-07. Our model favors Republicans in each of these seats due to a combination of incumbency and a heavy fundraising advantage.
In NJ-07, Republicans Tom Kean Jr is more likely to win than not, given the mix of the current environment, his fundraising, and his track record of overperformance. In AZ-06 and CA-45, conversely, Juan Ciscomani and Michelle Steel are favored despite not being heavy overperformers, simply because they currently have healthy fundraising advantages over their challengers.
Five Republican-held crossover seats are moving from Tossup to Leans Democratic. These are CA-22, CA-13, CA-27, NY-17, and NY-22. In each of these seats, the overwhelming wall of partisanship acts as a stumbling block for Republicans. For CA-13, CA-22, and NY-17, held by prior overperformers John Duarte, David Valadao, and Mike Lawler, respectively, this is enough to put them as slight underdogs despite fundraising advantages. Simply put, Biden won each of these seats by double digits in 2020, and it is really just a testament to their prior strength that these seats are even considered competitive at the moment.
In CA-27, Mike Garcia faces potentially the toughest test of his career against former Virgin Galactic CEO George Whitesides, a wealthy and prolific fundraiser in a seat that Biden won by double-digits. Garcia has never been outraised before, which has helped power him to upset wins against former assemblymember Christy Smith in the past; however, Whitesides has already lapped him in fundraising this time around, and our model views this as enough to tip the seat towards Democrats. Finally, in NY-22, Democrats have the advantage over Republican Brandon Williams following a favorable redistricting cycle that saw the seat become four points more Democratic.
Three Trump-won, Republican-held seats are moving out of the tossup column as well: CO-03, IA-03, and MI-10. The first, CO-03, was held by controversial Republican Lauren Boebert before she switched her reelection campaign to CO-04. Boebert’s race was the closest of the 2022 cycle and with her move, the model considers the seat Leans Republican on the basis of fundamentals and fundraising.
In IA-03, Republican Zach Nunn has a healthy fundraising advantage over both of his potential Democratic opponents. With former Congresswoman Cindy Axne out of the picture, there is little reason to keep this district at tossup.
Two seats are moving from Tossup to Likely Republican: MI-10 and VA-02. The main reason for the divergence is fundraising and incumbency.
In Michigan, John James, a slight WAR underperformer, is currently in a substantially better financial position than his Democratic opponent Carl Marlinga. Add that to the fact that James defeated Marlinga two years ago, and that current polling suggests a more favorable environment for Republicans in Michigan, and one can understand why James is currently a stronger favorite to win.
In Virginia, meanwhile, Jen Kiggans had an impressive 2022 win, unseating incumbent Democrat Elaine Luria in a seat that Biden won by less than 3 points. Given her hefty fundraising advantage and the fact that Virginia’s statewide environment is significantly worse for Democrats than it was in 2022, a Democratic win here would likely be a bit of a reach at the moment.
Special Cases
As with any quantitative forecast, there are always going to be a few seats where our own gut checks clash with the model’s read, and so a few special cases deserve some discussion here.
For both New Hampshire seats (NH-01 and NH-02), the Leans Democratic ratings are a shade more conservative than the Likely Democratic ratings we previously had. This is mostly downstream of the close state-level polling in the presidential race, with Biden leading New Hampshire by less than 3 points at the moment. Both seats mirror the statewide vote quite well — the first district would naturally be competitive in a redder environment, and the second district, while slightly bluer, is now open without an incumbent.
Finally, in South Texas, the two Democratic-held seats of TX-28 and TX-34 are currently rated as Safe Democratic. Rep. Vicente Gonzalez, in the 34th, is running in a solidly blue seat that has voted for Biden by double digits. While the Rio Grande Valley region may swing right, down-ballot lag will likely provide Gonzalez with some cushion, even with Republicans strongly pushing former Rep. Mayra Flores with strong fundraising.
We do expect that as polling comes out, the model will get a bit more bearish on this seat for Democrats. Ultimately, however, in a seat that was Biden +16 and Clinton +37, downballot lag is likely to be strong, and the model doesn’t expect Trump to win by nearly enough to pull Flores over the top.
In TX-28, incumbent (and regular overperformer) Henry Cuellar is running against Jay Furman, a military veteran who doesn’t have an identifiably Spanish surname. In an overwhelmingly Latino district, this dynamic will likely help Cuellar, especially considering that Furman currently lacks the money to run advertisements.
There is one twist, however: shortly after this model’s creation, Cuellar was indicted on bribery charges stemming from a scandal first uncovered in 2022. While this scandal didn’t move the needle last cycle, an indictment is a different and newer matter altogether, and it is possible that it could have a more pronounced effect in 2024. If it does, this has the potential to become interesting, and a future shift should not be ruled out.
Lastly, our forecast suggests that in this environment, WI-01 would be the longest of long shots for almost any candidate running against incumbent Bryan Steil, who has always won re-election by hefty margins. There is an interesting wrinkle, however; shortly after the model was created, former congressman Peter Barca announced his bid for the seat, and while we have limited data on his candidacy, all signals suggest that Democrats will be making a strong play for it. We wouldn’t be surprised if Steil eventually found himself in a real race this time around.
Takeaways
Ultimately, our model reflects the current reality on the ground and anticipates a tightly fought election, where control for the chamber will likely again be decided by the barest of margins. But polling currently suggests an environment significantly to the right of 2020’s, and until this changes, the House may not be nearly as Democratic-tilting as many felt in the immediate aftermath of the 2022 midterm elections.
This may be the biggest lesson of the model. The belief among many insiders was that if Democrats nearly won the House in a midterm election with an unpopular Joe Biden in office, a 2024 flip was a near-certainty. But this rested on the assumption that 2024 would be meaningfully bluer than 2022, and polling suggests that this is not a guarantee at the moment. In a scenario like this, it is unsurprising that our model biases towards well-funded incumbents, and it is why some Biden-district Republicans like Jen Kiggans and Tom Kean Jr. currently have a clear edge.
Once again, the House and the presidency are likely to be very tightly correlated. And unless Joe Biden begins to pull away from Donald Trump, the race for control of the House is set to be exceedingly close for a third straight cycle.
I’m a computer scientist who has an interest in machine learning, politics, and electoral data. I’m a cofounder and partner at Split Ticket and make many kinds of election models. I graduated from UC Berkeley and work as a software & AI engineer. You can contact me at lakshya@splitticket.org
I am an analyst specializing in elections and demography, as well as a student studying political science, sociology, and data science at Vanderbilt University. I use election data to make maps and graphics. In my spare time, you can usually find me somewhere on the Chesapeake Bay. You can find me at @maxtmcc on Twitter.
My name is Harrison Lavelle and I am a co-founder and partner at Split Ticket. I write about a variety of electoral topics and handle our Datawrapper visuals.
Contact me at @HWLavelleMaps or harrison@splitticket.org
I make election maps! If you’re reading a Split Ticket article, then odds are you’ve seen one of them. I’m an engineering student at UCLA and electoral politics are a great way for me to exercise creativity away from schoolwork. I also run and love the outdoors!
You can contact me @politicsmaps on Twitter.
I’m a political analyst here at Split Ticket, where I handle the coverage of our Senate races. I graduated from Yale in 2021 with a degree in Statistics and Data Science. I’m interested in finance, education, and electoral data – and make plenty of models and maps in my free time.