Historically, voters have punished or rewarded presidents at the polls for their perceived handling of the nation’s economy — Jimmy Carter in 1980 and Ronald Reagan in 1984 are two excellent examples of this effect from both ends of the spectrum. While this sentiment has arguably been misplaced at times, given the limited, peripheral role that presidents play in the immediate global economy, it still makes intuitive sense; voters decide to keep or change the status quo (defined as the party controlling the White House) based upon their lived economic experiences.
To better understand the relationship between the economy and the presidential election results, we decided to construct an out-of-sample, regression-based model of the incumbent party’s two-way vote share using three key fundamental measures: real GDP, sticky CPI (a more stable proxy for inflation), and the unemployment rate.

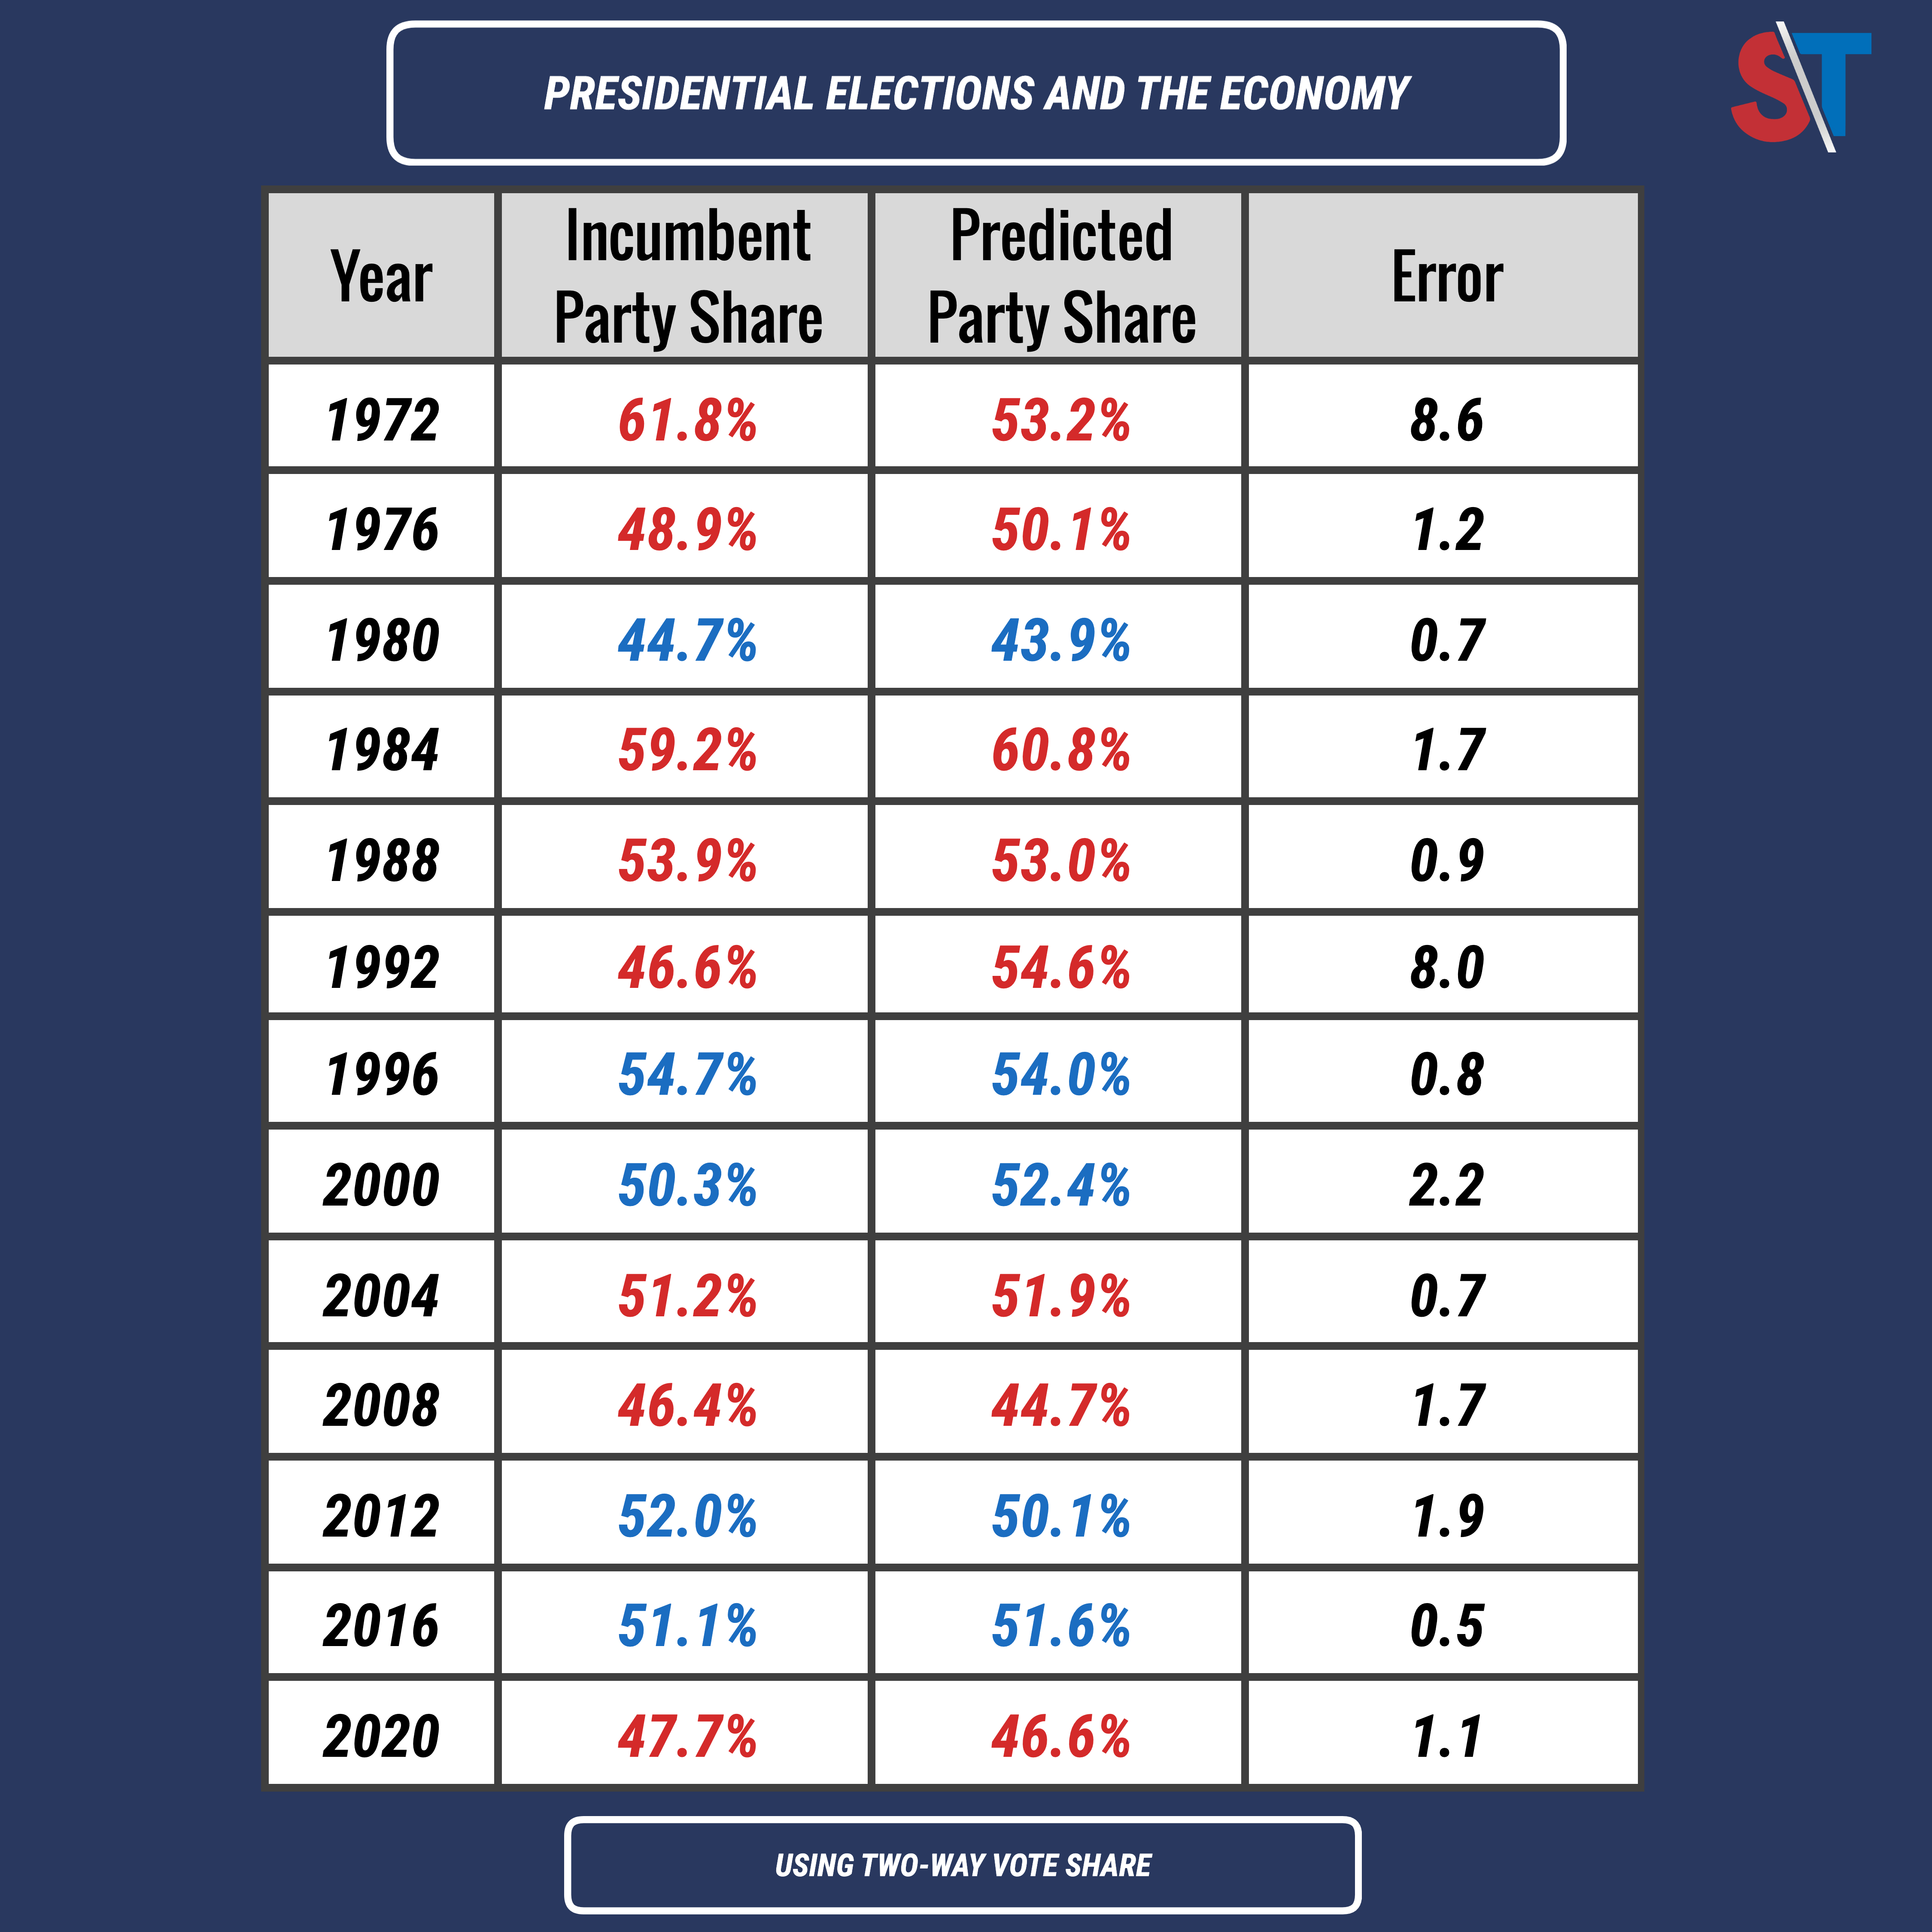
We found little difference between the incumbent party’s actual two-way vote share and the vote share predicted by the model. The fundamentals-based model forecasts had an average error of 2.3% and a median error of 1.2%, with only 1992 and 1972 standing out as clear outliers. In other words, our model strongly reinforced conventional wisdom: national economic conditions were highly predictive of the outcome in almost all of the last thirteen presidential elections.
Jimmy Carter’s 1980 re-election loss is the best recent example of an incumbent president who lost primarily as a result of poor economic conditions and public dissatisfaction with the vestiges of the Democrats’ New Deal-era fiscal policies. To put the state of the economy at the start of the Reagan Revolution in context, the inflation rate in 1980 was a whopping 13.5% – a figure we have not exceeded since.
On the other end of the spectrum, Ronald Reagan’s lopsided 1984 reelection shows the acclaim that voters may give a sitting president for a good economy. In Reagan’s case, the electorate rewarded him for the realization of continued real GDP growth in the aftermath of the 1981-1982 recession, which was caused by the ‘tight’ monetary policy response to the rampant inflation that was widespread throughout the 1970s.
There were two notable outlier years that our economic model struggled with: 1972 and 1992. Both of these can be explained by somewhat unusual electoral circumstances. In 1972, George McGovern’s campaign unraveled in spectacular fashion when he effectively forced his vice-presidential nominee Thomas Eagleton off the ticket after his previous battle with depression came to public light. McGovern was already a controversial nominee going up against a popular president presiding over the Vietnam War. His perceived ideological extremism, combined with the public implosion of the Democratic ticket, resulted in a landslide victory for incumbent president Richard Nixon.
Interestingly, previous Split Ticket research suggests that Perot’s strong third-party bid does not explain the 1992 error, as the electoral result likely would have been similar without him. The error is better explained by Bill Clinton’s capitalization on George H.W. Bush’s missteps that ultimately damaged his public image and cost him reelection despite excellent real GDP growth and approval ratings as high as 89% following victory in the Persian Gulf War in 1991.
After Bush broke his famous ‘read my lips, no new taxes’ campaign promise from 1988, Clinton criticized him for changing course throughout the 1992 campaign season and attacked the deficit spending of the Reagan years more broadly. His messaging resonated with voters, with the New York Times finding that of the 25% who said Bush’s broken promise was very important to their choice, roughly two-thirds of them voted for Clinton (which was over a third of his total support). The penalty for the president’s party was limited mainly to the presidency, as Republicans netted nine House seats in this election, suggesting that Bush’s image problem fueled his loss (as opposed to any economic backlash).
Ultimately, however, these were the only two real exceptions. For the most part, our model found an extremely strong correlation between the economy and the incumbent presidential party’s vote share, and most electoral results over the last several decades can be explained fairly accurately by the underlying economic fundamentals. However, the outliers serve as a strong reminder that while the state of the economy is often one of the top determinants of voter choice in presidential elections, voters do not always vote purely based on this.
After a cycle like 2022, that may be a good thing to keep in mind for 2024, regardless of whether the economic outlook continues to improve from the lows of the summer of 2022.
Citations
U.S. Bureau of Economic Analysis, Real Gross Domestic Product [GDPC1], retrieved from FRED, Federal Reserve Bank of St. Louis; https://fred.stlouisfed.org/series/GDPC1, July 19, 2023.
Federal Reserve Bank of Atlanta, Sticky Price Consumer Price Index less Food and Energy [CORESTICKM159SFRBATL], retrieved from FRED, Federal Reserve Bank of St. Louis; https://fred.stlouisfed.org/series/CORESTICKM159SFRBATL, July 17, 2023.
U.S. Bureau of Labor Statistics, Unemployment Rate [UNRATE], retrieved from FRED, Federal Reserve Bank of St. Louis; https://fred.stlouisfed.org/series/UNRATE, July 19, 2023.
I’m a computer scientist who has an interest in machine learning, politics, and electoral data. I’m a cofounder and partner at Split Ticket and make many kinds of election models. I graduated from UC Berkeley and work as a software & AI engineer. You can contact me at lakshya@splitticket.org
My name is Harrison Lavelle and I am a co-founder and partner at Split Ticket. I write about a variety of electoral topics and handle our Datawrapper visuals.
Contact me at @HWLavelleMaps or harrison@splitticket.org