
Last year, Split Ticket reviewed House-level election results for the 2020 and 2022 cycles and developed a metric to quantify what a “generic ballot” election result would have looked like. In such an election, every voter is presented with at least a Republican and a Democrat on the ballot at the House level.
While it would be simple to add up all the votes Democratic and Republican candidates received, this often glosses over the fact that in some congressional districts, voters do not have the choice of picking between both parties, whether due to uncontested races, jungle-primary lockouts, or failure to qualify for the ballot in a district. In all three cases, voters are not presented with the question pollsters give to determine a “generic ballot”: whether voters intend to vote for a Republican or Democratic representative in Congress. Split Ticket’s SHAVE (Substitutional House Aggregated Vote Estimate) model resolves this issue by substituting uncontested district results with a modeled result of how a district with a bipartisan presence would have voted.
We recently reviewed the model and made some minor modifications. Instead of using a topline margin shift in each state (e.g. from R +1 to R +3), our updated SHAVE instead uses changes in vote totals to more accurately model swing behavior. For example, in California in 2022, Democratic congressional candidates in districts received 59% of Biden’s vote in districts where they faced Republicans. Their opponents received 70% of Trump’s total, so we model uncontested districts as giving 59% of their Biden vote total to a hypothetical Democrat, and 70% of their Trump vote to a modeled Republican. This causes varying topline swings depending on district composition. Turnout is then computed post facto to match third party performance percentages in the seats that were contested on a state-by-state basis. In states with no districts with bipartisan presence, we simply apply the national change over the state.
Following this methodological change, we prepared SHAVE models for each cycle from 2008 to 2022, covering the current era of modern politics with clearer information about how the generic ballot would have really looked like if each district had bipartisan competition. This creates new and most importantly, more accurate insight on the national environment in each cycle.
2008

Fifteen years ago, Senator Barack Obama (D) handily defeated fellow Senator John McCain (R) in a 7.09% rout (or 7.28% with the inclusion of Washington, D.C., which does not vote for a voting member of the House of Representatives, and so its votes for the President will not be included in the vote tallies for this article).
This near-landslide actually fell short of the SHAVE margin for this election, as House Democrats are modelled to have outran their presidential counterpart by 1.6%. These strong Democratic performances came at the precipice of the Great Recession, which had catastrophic consequences for the Republicans, who held the White House and suffered the brunt of the blame for the disastrous economic conditions. Voters sought change, and that change came in the form of Obama and his fellow Democrats. The above map may appear foreign to the contemporary viewer; this is due to vastly greater rates of ticket-splitting in the featured time period. This ticket-splitting, combined with an unusual number of congressional districts lacking a candidate from either major party, has some negative effects on the quality of the SHAVE metric, so the states with a majority of seats being replaced by modelled vote totals have been marked for reference.
This ticket splitting extends to the Presidential race, where Arizona, the Dakotas, Mississippi, Missouri, and West Virginia were won by McCain and the aggregated Democrats, while Virginia, Florida, and Delaware were won by Obama and the combined congressional Republicans. This reveals the regional trends and candidate quality effects of the time period, an era before a near-complete alignment of presidential-level and congressional-level voting patterns. The production of the SHAVE verifies Split Ticket’s previous work examining the increasing rates of polarization in the modern political system.
2010

Although Obama had entered the Oval Office with a strong mandate — a trifecta with near supermajorities in both houses of Congress — the American public quickly reacted negatively to what they perceived as excessive government spending and the then-unpopular Affordable Care Act. This manifested as a stiff Republican wave against the Democratic trifecta, resulting in the House of Representatives flipping back to the Republicans in a massive wave, with a net 64 House seats and six Senate seats changing hands to the Republicans from 2008 to 2010.
States Obama had won, such as Nevada, Colorado, Iowa, Wisconsin, Michigan, Indiana, Ohio, Pennsylvania, New Jersey, New Hampshire, Virginia, North Carolina, and Florida voted for Republicans on aggregate, decisively handing the popular to the Republicans in an effective fourteen-point swing between elections, handing the Speakership back to the Republicans and positioning the party to make an attempt at taking back the White House. The strength of this Republican wave yielded results that may seem a bit bizarre today — for example, this was the last time that New Jersey’s SHAVE was Republican.
2012

2012 saw President Barack Obama reelected with a margin of 3.68% over Mitt Romney (R). This election followed the massive Republican wave election in 2010, and although the topline suggests Democrats should have succeeded in, or have come close to flipping back the chamber, extensive Republican gerrymanders locked in a 16-seat Republican House majority concurrent with Democrats holding the White House and gaining two seats in the Senate.
Republican House candidates carried Nevada, Ohio, Virginia, and Florida, which would have flipped the election to Romney had he run in tandem with his party’s downballot candidates (although Obama carrying North Carolina, like congressional Democrats did, would have flipped the election back). This is a recurring trend in the temporal scope of this article: statewide and presidential Republican candidates often underperform their House-level counterparts. Nationally, congressional Republicans outran Romney’s margin by 1.3 points, and Romney underran his GOP counterparts in every swing state except for North Carolina.
Part of this is due to President Obama’s immense strength in the Rust Belt. In fact, when combining Iowa, Michigan, Wisconsin, Pennsylvania, and Ohio, he outperformed congressional Democrats by 4.4 points. In doing so, President Obama helped Democrats maintain a favorable, pro-Democrat bias in the electoral college. Due to his lopsided wins in the Midwest, the tipping-point state was Colorado, which Obama won by 5.4 points (1.5 points more than his national margin of D +3.9).
But interestingly, this bias was not present if we translate the SHAVE margins to the electoral map; in the scenario mapped above, the tipping-point state is actually Pennsylvania, which was decided by 1.5 points and was 0.9 points to the right of the national House vote.
2014
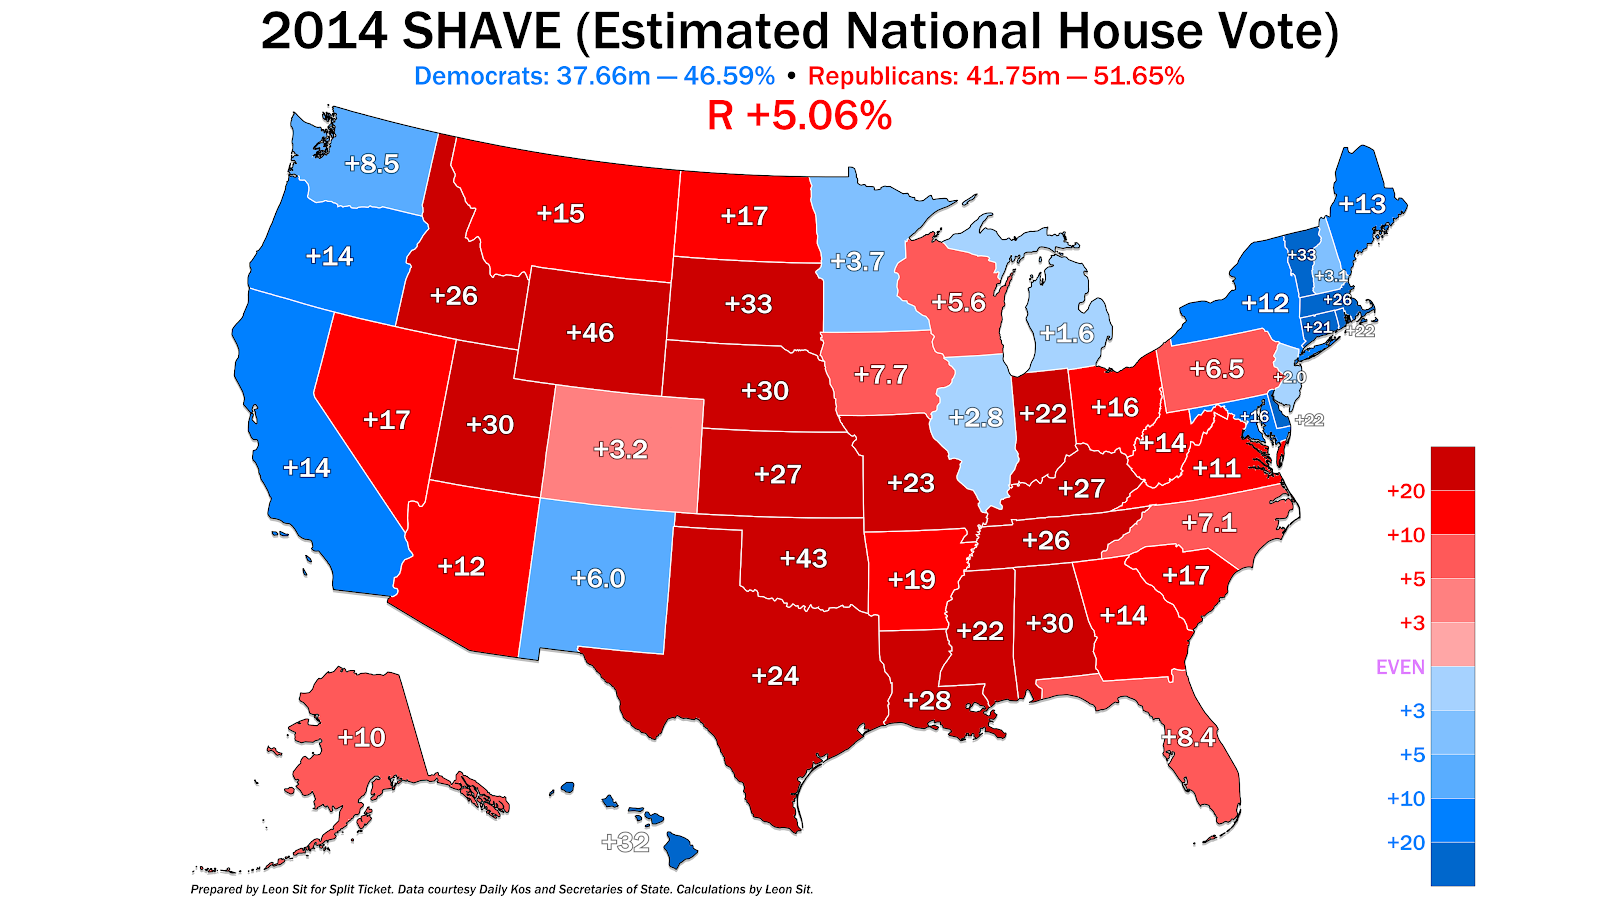
2014 was a year of extraordinarily-low voter turnout, with a mere 80 million votes being cast in a country of approximately 320 million. More Republicans returned to the ballot box than Democrats, fueling another, smaller, red wave after 2010, leading to a GOP win of the SHAVE metric by over five percent. This blood-red environment helped Republicans expand their House majority to its greatest extent since 1928 and retake control of the Senate for the first time since 2006, when both legislative chambers flipped to the Democrats.
Although this wave was actually of a similar partisan environment to 2010, there were significantly fewer Republican flips, simply because there was far fewer “low-hanging fruit” for them. Heading into 2010, Democrats had 256 seats, including 49 in districts that had voted for McCain in states such as Mississippi, Tennessee, and Arkansas. 2010 saw 37 of such seats flip to the Republicans. By 2014, the then-recent 2010 Republican wave and the subsequent redistricting process had wiped out many of these opportunities in split-ticket districts, meaning that there were fewer gains that the GOP could realistically make to begin with. However, Congressional Republicans still expanded their majority to a whopping 247 seats, a GOP record in the post-Depression era.
Some consequences of the low-turnout year are apparent in some solidly-blue states such as Illinois and New Jersey. In both states, Republican coalitions had higher vote propensities than their rivals, and so in the 2014 election, the SHAVE in both states showed a very narrow Democratic win margin in states which solidly went to Obama two years prior. This election would be the last time to date that New Jersey, Washington, or Illinois would have generic ballot margins within single digits, as well as the last time Arkansas and West Virginia’s would be within 20 points of the national lean, as Republican candidate Donald Trump’s ascent to the peak of American politics in the following cycle would upend the political world.
2016
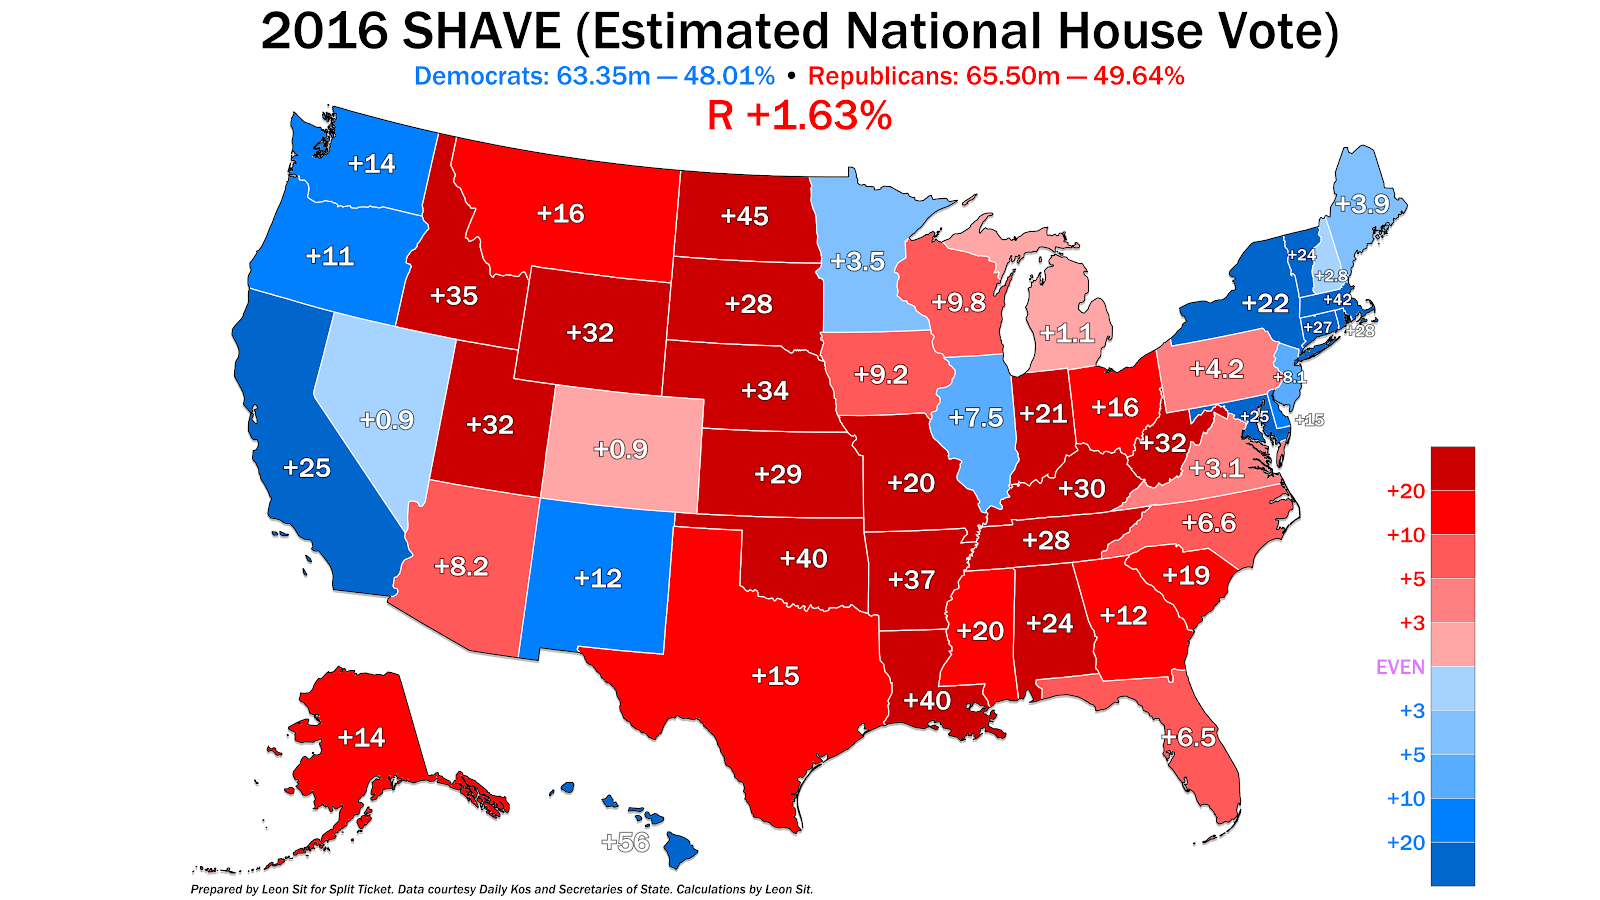
2016 saw the return of presidential-year turnout, with both parties turning out to succeed President Obama with either Hillary Clinton (D) or Donald Trump (R). Although Clinton won the popular vote by 1.92%, a large number of ticket-splitters colored the national congressional environment red. It has been theorized that the apparent pre-election likelihood of a Clinton victory led to many ticket-splitting independent voters voting for Republicans in downballot races when they might have preferred a different candidate had a Trump victory been a more clear possibility.
The only states which split their tickets in this cycle were Colorado and Virginia, which voted Democratic for the presidency and Republican in House races. As Colorado and Virginia are states with large portions of highly-educated suburban white voters, they are strong examples of how the GOP maintained their advantage in the House, even as the presence of Trump somewhat would come to hurt the GOP in those states in the near future. Even in Illinois, where Democrats won the presidential contest by 17 points, House Democrats underran this margin by nearly 10 points, according to SHAVE.
2016 represented a high-water mark of GOP coalition strength in the House. Even though the party lost six seats from 2014, the Republicans still held 241 House seats, and maintained a strong presence in numerous suburban areas around the country, while taking advantage of the sudden realignment of rural and working-class white voters brought on by Trump’s presence.
2018
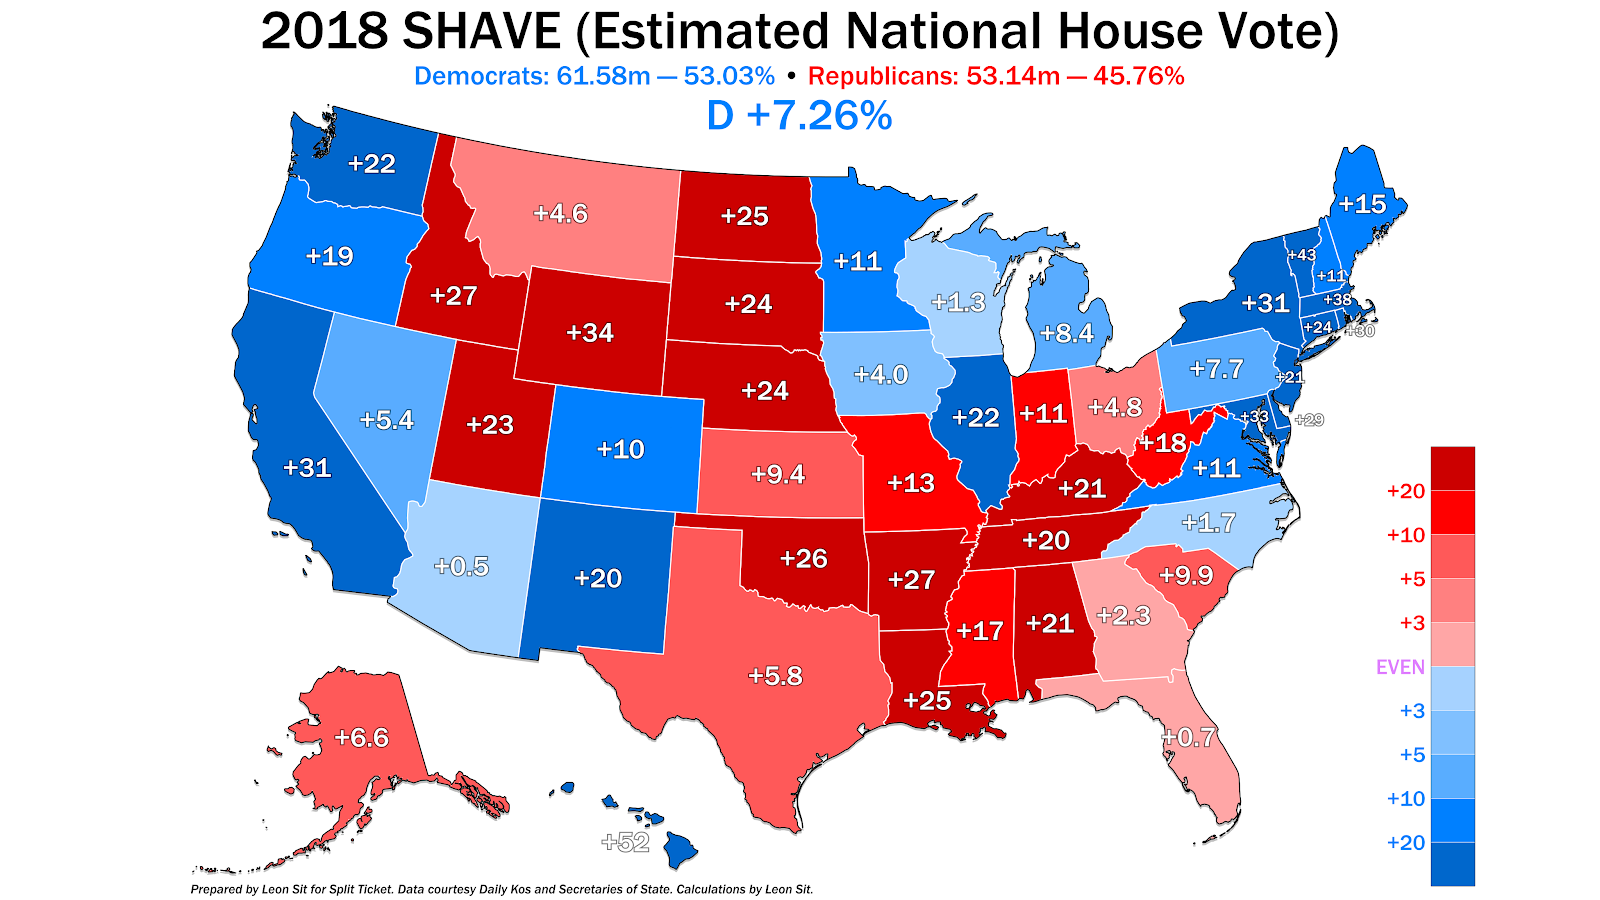
Independents seeking a split government may well have come home to roost for Democrats in 2018. The Trump presidency quickly hit rocky waters and low approval ratings, leading to a massive backlash in the 2018 blue wave election, which saw the House flip back to the Democrats. Many states and districts which had voted for Trump now elected Democrats, notably materializing as a reformation of the “blue wall” in the Midwest.
Many high-propensity suburban white areas which had been open to backing Republicans suddenly threw their old loyalties off and joined the Democratic coalition. In addition to once again winning a majority of votes in the Midwestern “blue wall”, former Republican strongholds such as Arizona, Georgia, and Texas flashed onto the board of competitiveness, while previously-Republican swing states like Virginia and Colorado became firmly Democratic.
States where the Democratic coalition is reliant on minority voters also posted extremely strong showings for the party, in spite of historical trends of lower minority turnout in midterms. California, New Mexico, and New Jersey, and New York all saw Democratic swings in their SHAVE vote. Specifically in California, Democrats capitalized on favorable political winds to sweep formerly solidly-Republican Orange County’s congressional seats for the first time in modern history.
The blue wave of 2018 was not solely limited to areas that are competitive in the presidential race, though. Montana and West Virginia all saw Democratic swings thanks to high-quality candidate recruitment in both states, as well as the strong re-election campaign operations of their incumbent Democratic senators. But while Democrats had hoped that the disproportionate gains made by them in the rust belt were a hint that 2016 was an aberration, 2020 would show that the real picture was far more complicated than that.
2020
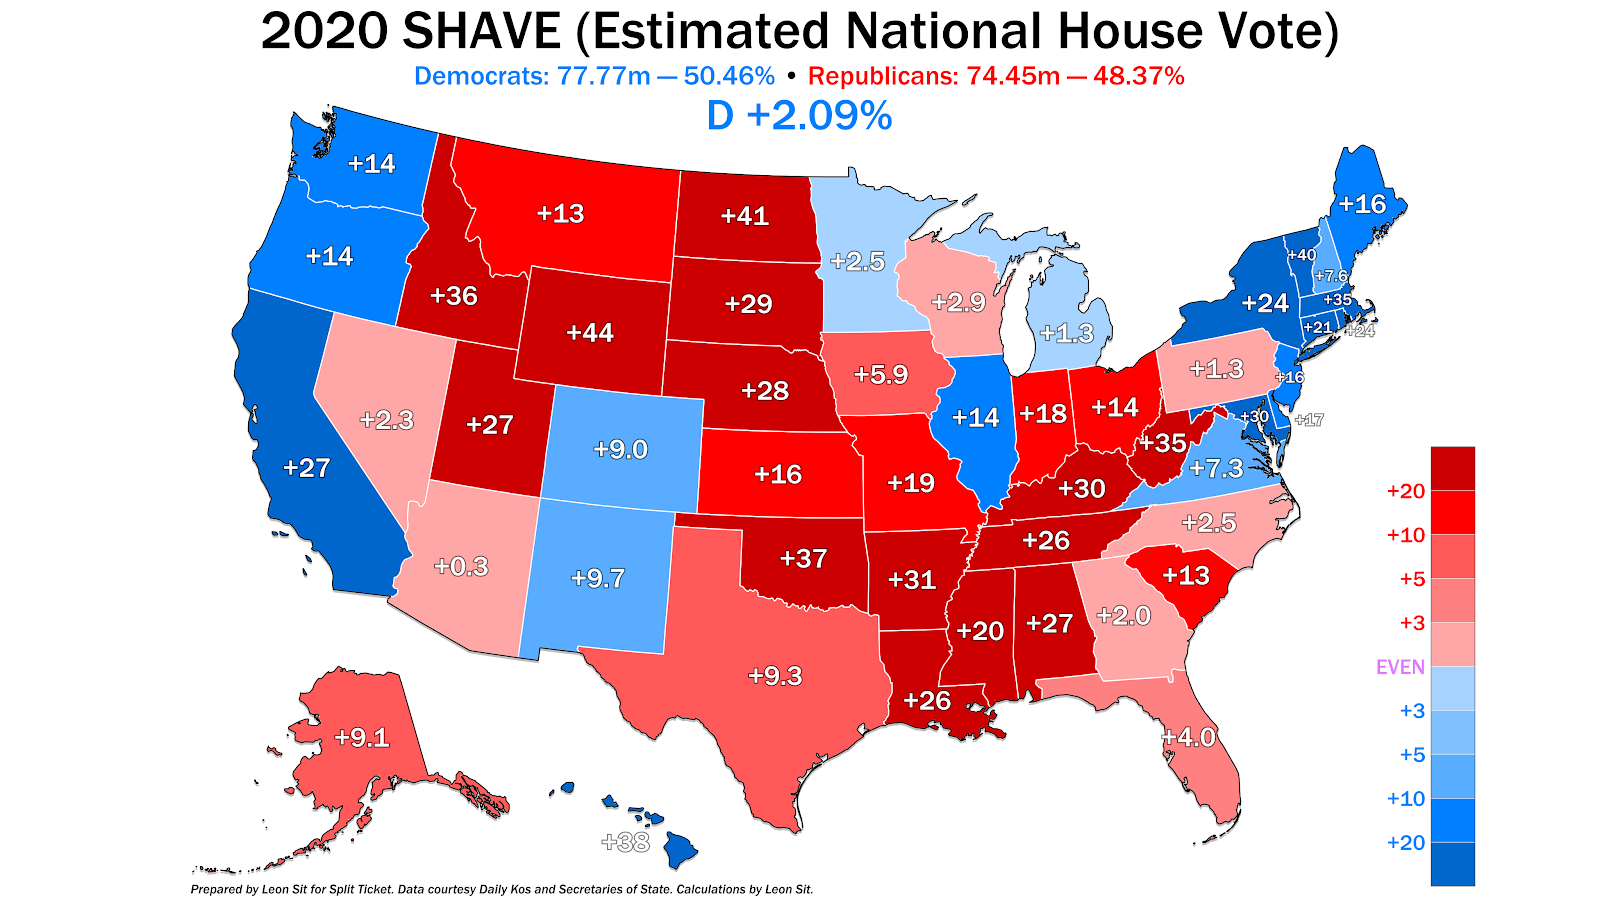
Despite the Democratic momentum in 2018, many of their gains were reversed in 2020, with no Republican incumbent losing reelection in a set of surprise House flips happening simultaneously with the Senate flipping to the Democrats and Joe Biden (D) defeating incumbent President Trump. The 2020 election was heavily polarized, fueling a massive turnout surge on both sides, and a national SHAVE of D +2.09%, compared to Biden’s win margin of 4.28%, showing again a case where Republican presidential candidates failed to run in par with their congressional counterparts.
This election saw the tightest correlation between downballot and presidential margins, as crossover voting largely evaporated. For the first time, there were no states in which the divergence between the presidential margin and the statewide SHAVE exceeded 10 points. This meant that the outcome of the presidential race came to play a greater role in determining the fate of congressional candidates than ever before. Even then, however, there were some notable differences at the margins.
Republican congressional candidates, on aggregate, won Arizona, Nevada, Wisconsin, Pennsylvania, and Georgia, five states which Biden won. If Trump had carried these states, he would have held the presidency, suggesting that his divisive personal image may have cost him a “winnable” election. Democrats also won many Senate elections in states with Republican SHAVE’s, in another instance of Republican statewide candidates underperforming their congressional counterparts.
2022
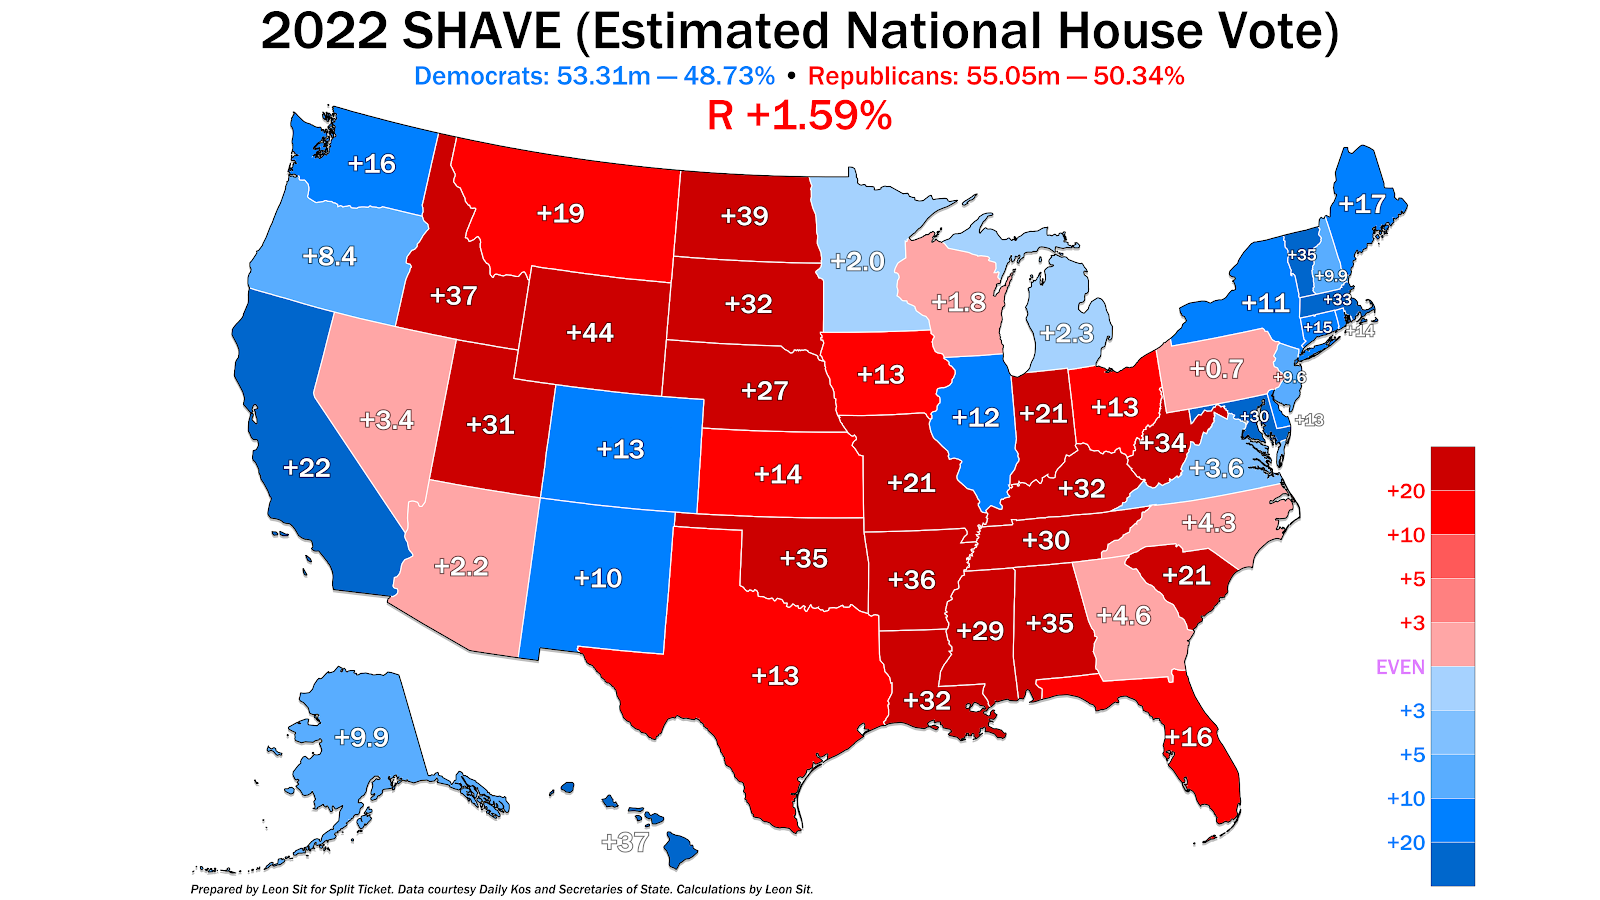
Most recently, President Biden faced a midterm election under high inflation rates and low approval ratings. But due to the repeal of Roe v. Wade and the specter of the unpopular former President Donald Trump hanging over the GOP, Republicans faced a big penalty among independents, who according to exit polls voted for the incumbent Democratic Party in a massive divergence from historical precedent.
In particular, pro-choice midwestern swing states with large, white secular populations, like Michigan, Ohio, Pennsylvania, and Wisconsin, actually swung left from the 2020 elections, due to a combination of weak candidates at the top of the ticket and state-specific environments. Meanwhile, states with larger non-white populations like Florida, New York, and California saw pronounced shifts right due to cratering Democratic turnout and a more traditional midterm shift by independents against the presidential party.
As noted before, Republican statewide candidates for Senate and Governor often significantly underperformed their congressional counterparts. Despite increasing political polarization, Democrats won Senate seats in four states with Republican SHAVE’s (Pennsylvania, Nevada, Arizona, and Georgia), which allowed them to retain and expand their Senate majority despite a majority-Republican electorate.
While this metric serves as an interesting and elucidating exercise in political data analysis, it is important to know that it is impossible to truly know how elections would have turned out, even as political polarization increases and election margins become more predictable as a function of presidential election results. This was most clear while processing numbers before 2016, where ticket-splitting rates were far more significant. This also means that a “generic” election outcome was harder to model for such years, as particular candidates in smaller states, such as Charles Djou of Hawaii, could drastically change the outcome of the SHAVE model with significant overperformances.
However, one takeaway makes itself clear, even with the sharp decline in ticket-splitting: Republicans have recently lost quite a few statewide and presidential elections in swing states that should have been winnable had their downballot supporters persisted up the ballot. Whether it be the 2020 Presidential election or the Senate races in the 2020 and 2022 cycles, GOP candidate quality has cost the party a significant number of crucial victories, leading to their current political situation.
We hope you enjoyed this piece. If you did, please consider subscribing to get our articles in your inbox — it’s free!
I make election maps! If you’re reading a Split Ticket article, then odds are you’ve seen one of them. I’m an engineering student at UCLA and electoral politics are a great way for me to exercise creativity away from schoolwork. I also run and love the outdoors!
You can contact me @politicsmaps on Twitter.
I’m a computer scientist who has an interest in machine learning, politics, and electoral data. I’m a cofounder and partner at Split Ticket and make many kinds of election models. I graduated from UC Berkeley and work as a software & AI engineer. You can contact me at lakshya@splitticket.org
I’m a political analyst here at Split Ticket, where I handle the coverage of our Senate races. I graduated from Yale in 2021 with a degree in Statistics and Data Science. I’m interested in finance, education, and electoral data – and make plenty of models and maps in my free time.