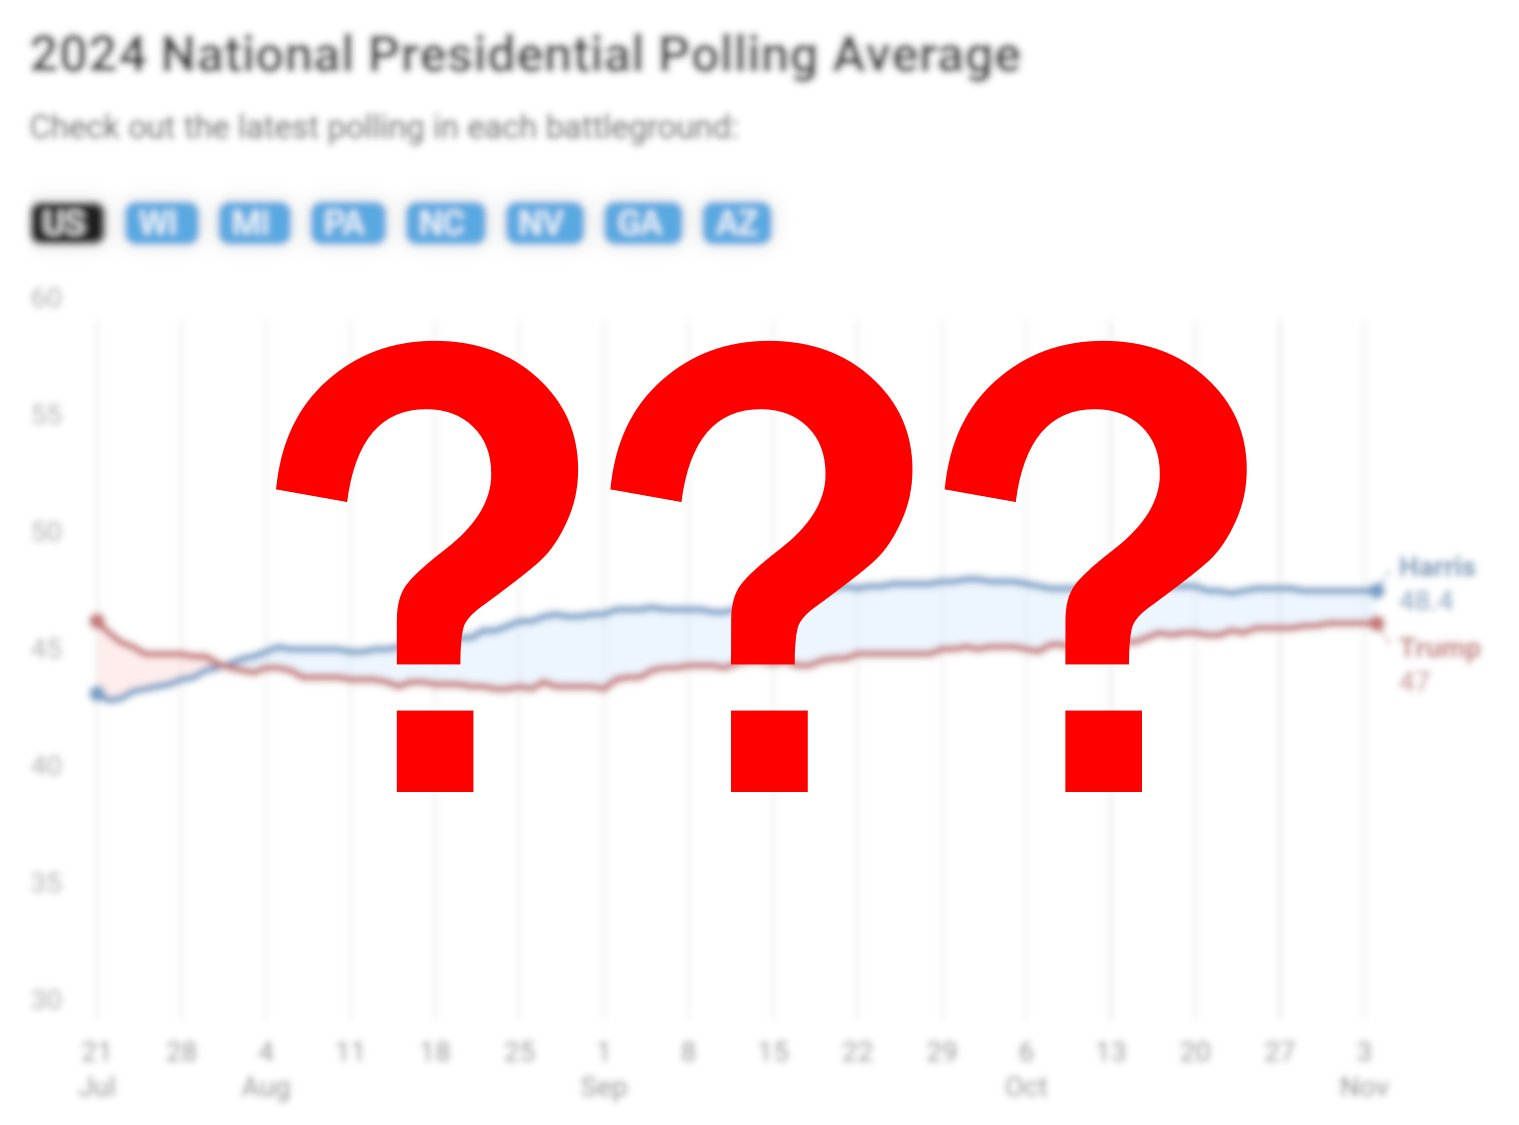
Going into election night, polling suggested a close race between Kamala Harris and Donald Trump, with surveys showing less than a half percentage point separating the two candidates in the tipping point state in Pennsylvania. The bulk of polling suggested that the race would come down to the wire, with a Trump or Harris sweep consistently remaining in the margin of error across polls run by different firms. Ultimately, Trump swept the swing states, but won the tipping-point state of Pennsylvania by just under 2% more than where polls ultimately had it.
Unlike 2016 and 2020, Trump did not overperform his polls by a wide margin. In all but two swing states, polls underestimated Trump by only 2–3 points. Polls in Georgia were pretty close to spot on, at just a 1 point error.

This is well within the boundaries of a normal year for polling. The polls are often off by a few points, and this year was no different. Throughout the campaign, we emphasized that a minor polling error could easily lead to either candidate sweeping all seven core swing states. This scenario happens to be the one we ended up in. Trump narrowly outperformed his polls, but he trailed so narrowly in the first place that all seven states broke toward him.
Part of what made polling especially and uniquely critical this cycle, however, was that the non-polling indicators that worked so well in previous cycles completely failed this time around. The Washington top-two primary, special elections, and economic fundamentals all pointed to an environment between D+2 and D+4. Polls, however, picked up on the change in the national environment and correctly suggested that the national vote would be competitive — Harris only led our final national polling aggregate by a shade over a point. (This is why our model, which was built on polls, classified the race as a tossup, which somewhat flew in the face of non-polling indicators.)
The national shift came as a shock to most people, especially given that Republicans had not won the popular vote for twenty years and had only done so once since 1988. That a former president with underwater favorability numbers could win the popular vote against a vice president who was breakeven in favorables seemed to beggar belief, especially considering that Trump had lost it handily the last two times he was on the ballot. But anyone looking purely at national polls would not have been surprised by the eventual result.
Polls were also correctly able to reconcile a close set of elections in the swing states with a large rightward swing in the national vote, which was something many people found impossible in the wake of 2020. The electoral college bias has now essentially vanished from the map — if current results hold, the electoral college bias will be just under a point in favor of Republicans, after two cycles in which it favored Republicans by 3 to 4 points. Polling averages picked up on this shift as well — in our averages, the electoral college bias was just R+1.
If swing states were to be competitive despite a tied national vote, Harris must have been losing a lot of ground elsewhere. And this was also borne out in the eventual results — throughout non-battleground states, both red and blue, Kamala Harris plummeted. She is ahead 56–44% in New York, down from Biden’s 61–38% victory in 2020. Remarkably, she leads just 52–46% in New Jersey, a reliably Democratic state that Biden carried 57–41%.
Trump’s big gains across the country were powered not only by further gains with working class whites, but also by surges with nonwhite, particularly Hispanic, voters. Unlike previous Democratic candidates, Harris was unable to respond with further gains among college-educated whites; in some places, it actually appears that Harris may have slid backward with this group.
Did polls pick this up? It’s something of a mixed bag. Let’s talk, for a moment, about the NYT/Siena College polls.
Pollsters need to make assumptions about what the electorate will actually look like. It can be unreasonable to assume that just hundreds of respondents will properly reflect the makeup of hundreds of thousands, or even millions, of voters without some adjustments. Many polls, in an effort to capture Trump voters they believed they had missed in 2020, began weighting by “recalled vote”, or elevating the responses of supporters of the candidate who is underrepresented in comparison to the 2020 results.
This was previously considered heresy amongst pollsters, but in the wake of 2020, it began to gather momentum as a last-gasp method to ensure that Trump voters (who were the least likely to respond to polls) were actually represented in surveys. The effect of this method is to strongly tie the poll to the 2020 result, because by definition, any poll that weights by recalled vote must have fixed representation of self-professed Trump and Biden voters alike. And indeed, many polls were finding a “2020 redux”.
But the danger here is twofold. Firstly, people don’t always remember who they voted for — a small segment will give an answer either in line with the winner of the last election (known as “winner’s recall bias”) or an answer in line with who they currently plan to vote for, rather than whom they actually voted for. In weighting by recalled vote, therefore, pollsters often risked using imprecise and improper data. Moreover, this decision can also mask underlying changes in the electorate, such as migration (which, in the cases of Florida and Arizona, is quite critical) and shifting enthusiasm.
Throughout the year, the New York Times/Siena College polls, which do not weight by recalled 2020 vote, found results diverging from many other pollsters. In particular, they found continued weakness for Harris throughout much of the Sun Belt, driven by historic losses with nonwhite voters, especially Hispanics. One of their most eye-popping polls of the cycle came out of Florida, where they found Trump up 13 points in a state he won by just 3 in 2020. Similarly, their last poll of Texas found Trump up 10 points. Instead of a 2020 repeat, they found something more akin to a 2022 redux.
The New York Times polls were far from perfect, of course — their final set of polls had Harris leading by a couple points in several states that she eventually lost. But they were extremely useful in reflecting the ways 2024 looks more like 2022 than 2020, a conclusion generally missed by polls that were weighted to recalled 2020 vote. They were also the first to nail the divergence in the electorate among the engagement gap, which showed that fringe voters were substantially redder than the most engaged voters that voted in special elections and midterms.
We don’t mean to say that weighting by recalled vote is always wrong — it still remains an exceptionally effective tool to blunt the issues posed by nonresponse bias (known to most as the “silent Trump supporter” phenomenon) and yield a more accurate topline. But the polls that relied on this phenomenon also generally failed to “tell the story” of the election, which is arguably almost as important as the results themselves. What sets the Times polls apart is not just their accuracy (which will still grade out quite well) — it is instead the consistent, clear, coherent, and ultimately correct story that they told about the electorate and its changes, which polls that weighted by recalled vote frequently did not do.
Moving to the subgroup level, the biggest error that polls generally stumbled into was missing Harris’ stagnation with college-educated whites. That Harris slid with both nonwhite voters and non-college whites was hardly a surprise; polls often found her doing worse with both. But her polling strength lay among college-educated whites, with whom she was exceeding Biden’s margins.
If that forecast sounds familiar, it’s because that story was roughly what happened in 2020. But in the results this time around, we see that these gains generally did not materialize; with the exception of the Milwaukee suburbs, Harris generally underperformed Biden across many educated white areas, which proved fatal to her chances of victory.
In Nebraska’s 2nd district, which contains Omaha and its suburbs, Harris slid from Biden’s 7-point margin to one just under 4 points. This amounted to an error of nearly 6 points relative to our averages, substantially larger than the swing states. This dynamic was not limited to just Nebraska’s 2nd; she also underperformed Biden’s numbers in the highly educated Philadelphia collar counties, as well as suburban Oakland County in Michigan.
There is, however, an underlying concern for pollsters. While the polls were quite accurate overall, there still does not appear to be a single state in which they underestimated Harris. Instead, Trump consistently outran his polls. This is somewhat unusual, as errors often cut both ways (2022 polls, for example, underestimated Republicans in Florida, but also Democrats in Michigan). It may be possible that, while more accurate than 2016 and 2020, pollsters may still be struggling to pick up a small but decisive Trump-supporting part of the electorate. In either case, however, it is worrying that this has happened for the third straight presidential cycle, even though the size of the miss is far smaller than before.
A final note: that shocking Selzer poll will end up being one of the worst in the cycle. At the time, it showed Harris ahead 47–44 in Iowa—a state Trump had won by 8 points in 2020. The Selzer poll was an outlier from the start, and it ultimately hit far off the mark; Trump ended up carrying Iowa by 13 points, tarnishing Selzer’s relatively clean record.

In the Senate, Democratic candidates largely outperformed the top of the ticket in competitive races. At the same time, polls ended up slightly underestimating Republican Senate candidates. This effect was more pronounced in some states than others. In Maryland, for example, there was almost no error. The biggest miss this cycle was Nevada, where polls consistently underestimated Republican Sam Brown. Incumbent Democrat Jacky Rosen ended up winning by less than 2 points.
The only state where the polling average incorrectly predicted the outcome was Pennsylvania. There, Democrat Bob Casey looks like he’ll narrowly lose reelection to Republican David McCormick by 0.3 points — a 3.7 point error. In the end, the polls broadly underestimated the GOP.
However, polls proved quite accurate at forecasting the deltas in key Senate races. In Montana, Ohio, Arizona, and Wisconsin, there was little to no divergence between the expected and actual differences. For many who have witnessed recent election cycles, this may come as a surprise. Ticket-splitting was especially minimal in 2020, when many candidates from both parties struggled to outrun the top of the ticket at all. Despite this, polls consistently found Senate candidates (mostly Democrats) substantially outrunning the presidential numbers.

While our polling averages found that this difference shrank over time, the final gap in the polls between Senate and presidential numbers actually held up in most races. In one state, Texas, polls actually undershot how much Ted Cruz would underperform Trump. Even in Nebraska, where it was assumed political gravity would eventually narrow the shockingly large gap between Sen. Deb Fischer and Donald Trump, it turned out that independent candidate Dan Osborn really was headed for a double-digit overperformance — just not one that was large enough to win.
So how did the polls do, overall? It is clear that Republicans outperformed their polls nearly everywhere, but in absolute terms, polls still came pretty close to predicting the final results. There was no error anywhere near the scale of 2016 or especially 2020, and unlike what we saw in those years, the polls did substantially better than any non-polling indicator did. But polling error is often correlated, and in an era of 50/50 elections, being off by just one or two points can make all the difference. That’s why our forecast said it was a tossup until the end — and ultimately, that’s why a Trump victory wasn’t a surprise.
I am an analyst specializing in elections and demography, as well as a student studying political science, sociology, and data science at Vanderbilt University. I use election data to make maps and graphics. In my spare time, you can usually find me somewhere on the Chesapeake Bay. You can find me at @maxtmcc on Twitter.
I’m a computer scientist who has an interest in machine learning, politics, and electoral data. I’m a cofounder and partner at Split Ticket and make many kinds of election models. I graduated from UC Berkeley and work as a software & AI engineer. You can contact me at lakshya@splitticket.org
My name is Harrison Lavelle and I am a co-founder and partner at Split Ticket. I write about a variety of electoral topics and handle our Datawrapper visuals.
Contact me at @HWLavelleMaps or harrison@splitticket.org