In a cycle characterized recently by immense upheaval, stability is perhaps the last thing that would come to mind regarding the 2024 elections. Yet for perhaps the first time in months, that is exactly what would characterize our forecasts right now.
Coalitions are largely set (in fact, FiveThirtyEight’s crosstab aggregates show hardly any movement over the last month among subgroups), and polling averages have settled into a fairly consistent picture, with a small Harris edge in Nevada and the “Blue Wall” states of Michigan, Wisconsin, and Pennsylvania, and a small Trump edge in the Sun Belt states of Georgia, North Carolina, and Arizona.

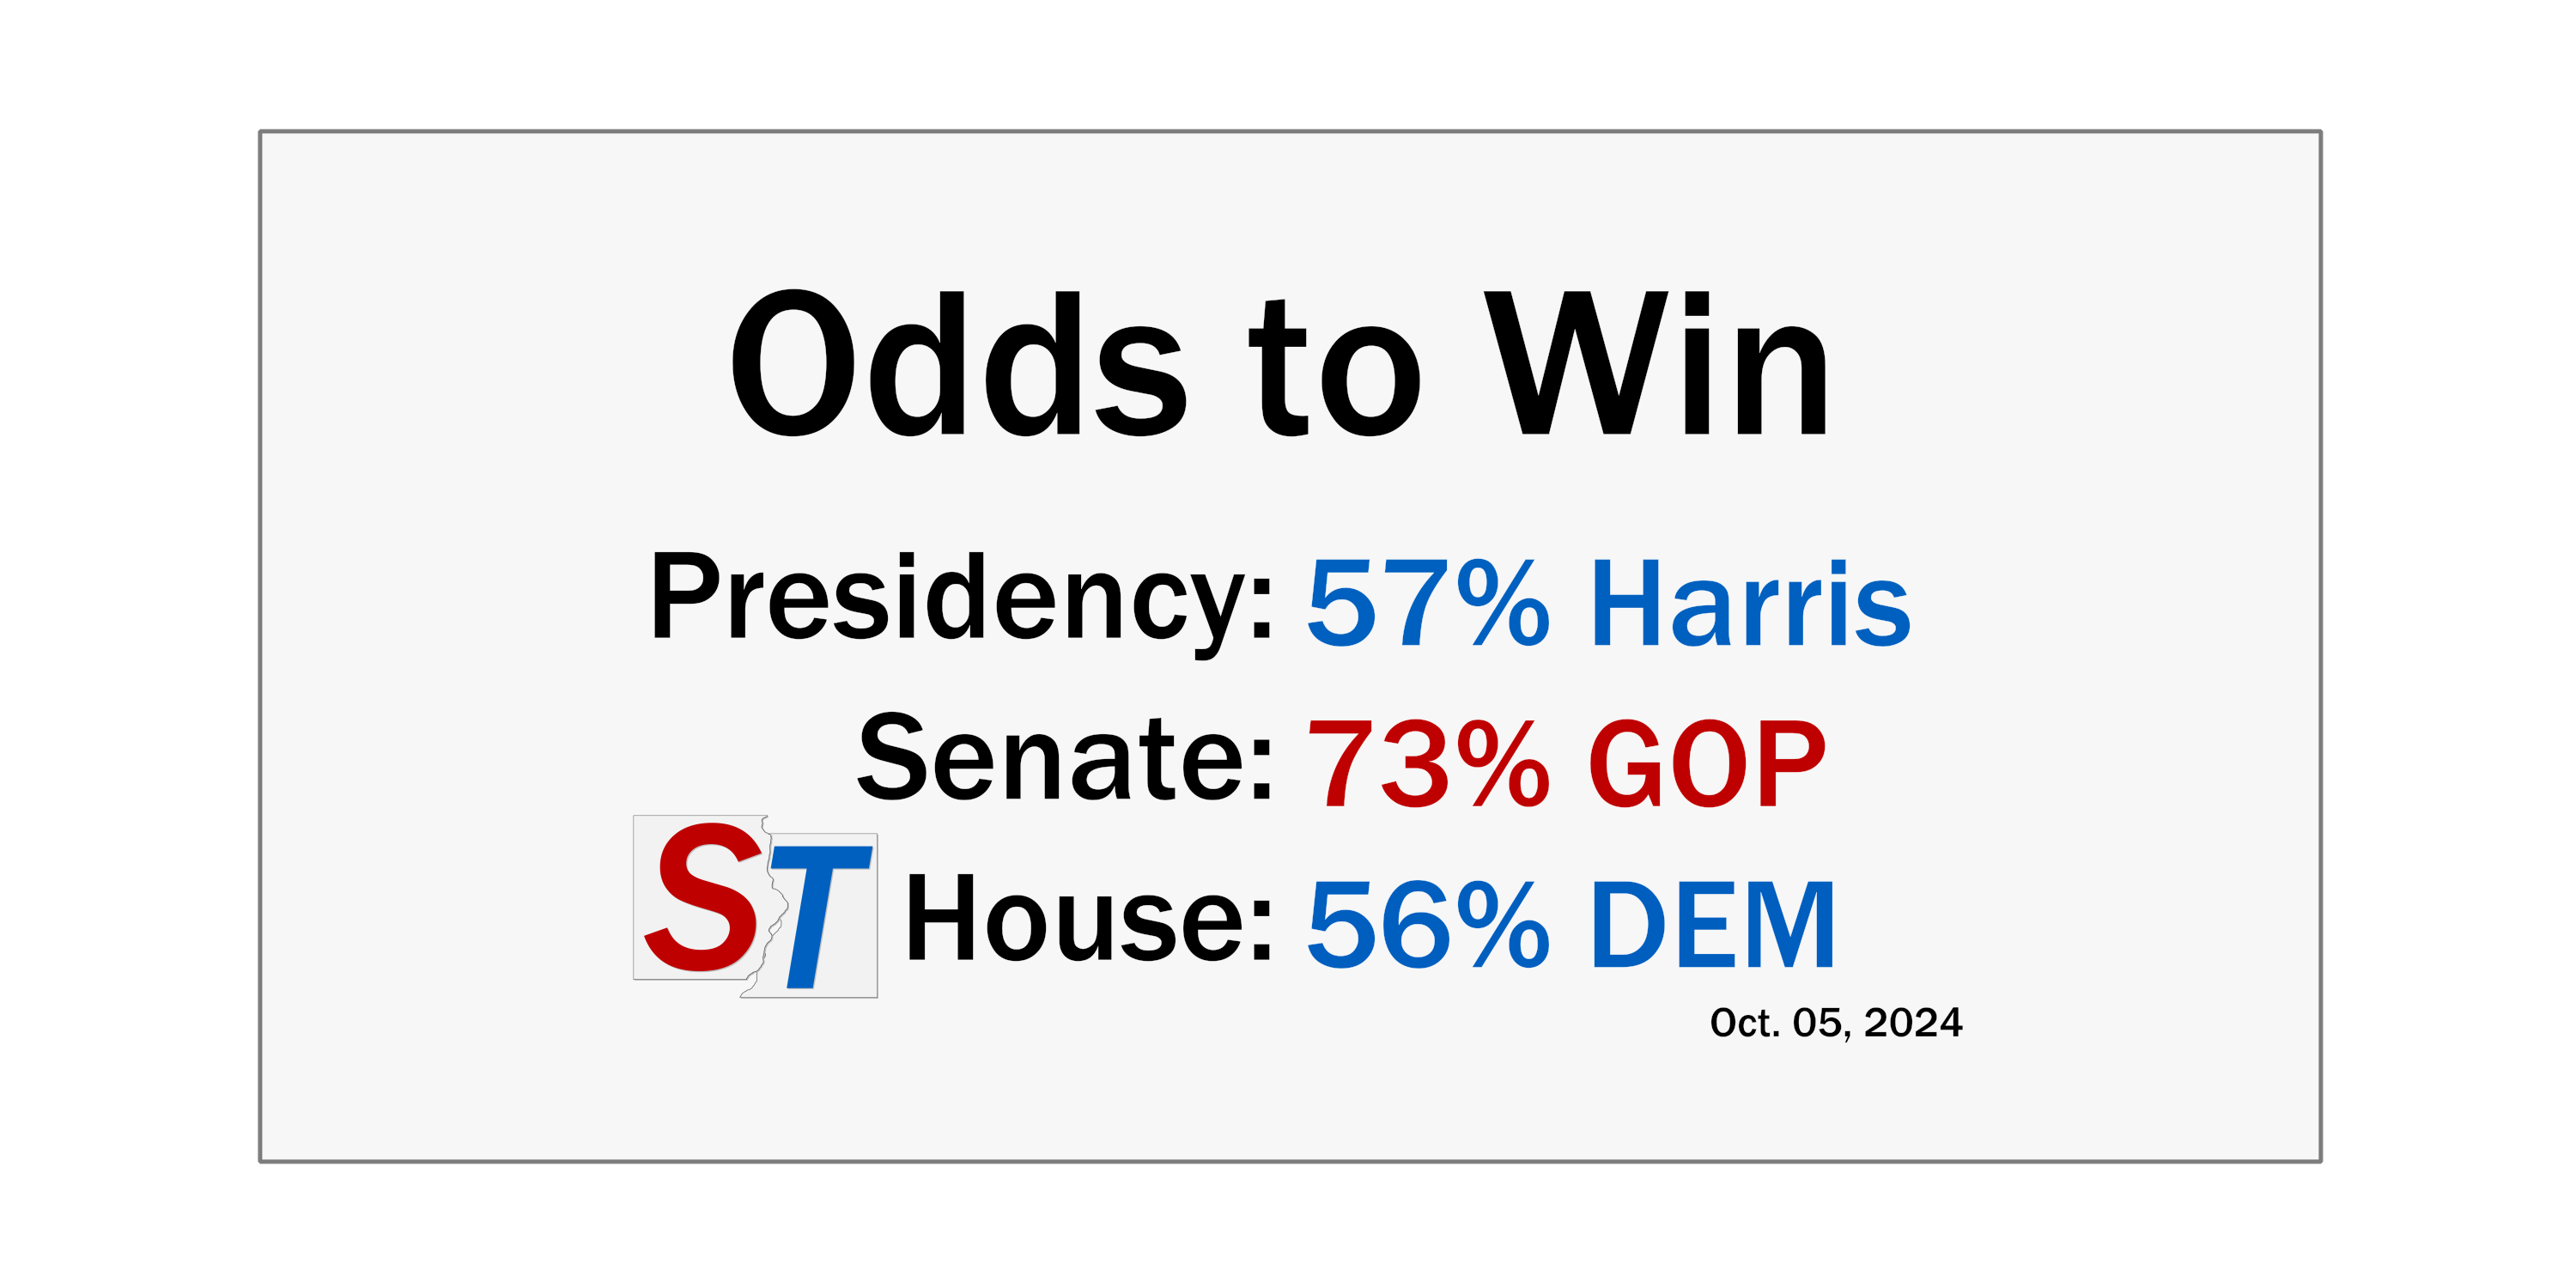
Our presidential model hasn’t moved much either, as the latest data places Harris’ chances at 57%, which is identical to her odds last week and just a touch below the odds they launched at. The Vice President’s best path to victory relies on holding Michigan, Wisconsin, and Pennsylvania, while winning Nebraska’s 2nd Congressional District to put her over the top at 270 electoral votes.
There is a wrinkle: her current advantage in Nevada and her improvement over Biden in North Carolina puts another path into play as well — Harris only needs a minor polling error in the state to open up another path to the White House. She could still win the presidency if she “trades” one of Pennsylvania, Michigan, and Wisconsin for wins in Nevada and North Carolina.
This brings us to the central point we wish to impress upon readers: None of these outcomes would be surprising. Our forecast has settled into a fairly stable picture, but that does not mean that the race is overwhelmingly likely to remain static from 2020. Though the available evidence currently suggests the presidency is a blue-tilting tossup at the moment, both a Harris landslide and a Trump victory exceeding his narrow 2016 margins are well within the bounds of possibility.
Consider the following: as per our polling averages, Harris leads by 2% in Michigan, Nevada and Wisconsin, and has a 1% edge in Pennsylvania. Conversely, she trails by a whisker in North Carolina, Arizona, and Georgia. A normal-sized polling error could catapult her over the top in all of the remaining swing states while making Florida and Texas jump balls.
These types of errors happen all the time in either direction — everyone remembers the pro-GOP polling errors in 2016 and 2020, but in both 2012 and 2022, Democrats were actually underestimated by similar margins in several swing states, especially in the Midwest. And while polls in states like Georgia have been pretty good in recent times, Trump’s lead in the state is so narrow that even the most minor of polling errors in the wrong direction would see him lose.
People are consistently unwilling to believe we could see big changes from the 2020 map. And indeed, our model doesn’t forecast this as the base scenario either. But it’s built with historical polling error and state correlations in mind, and in every recent cycle, we have seen polling misses and massive shifts in either direction in a variety of states and districts.
For instance, it was just last cycle that we saw Florida swing right by three points, even as Georgia swung left by five. And virtually nobody predicted Democrats losing that much ground with Latino voters in 2020, especially just one cycle after putting up near-record margins with them.
Polls don’t always miss in the same direction in the same cycle either. In 2018, for instance, polls generally overestimated Democrats in the Midwest and Republicans in the Sun Belt, with Sherrod Brown and Ted Cruz both winning a race that ended up significantly closer than polls suggested. Our model handles this through the concept of correlated error — missing in Texas makes it more likely that we see a miss in Arizona, but it has little impact on a miss in Michigan.
This yields some pretty interesting scenarios. For example, despite the median outcome being a map that’s fairly close to 2020, as one might expect in times of high polarization, there is still a 15% chance that Harris wins both Florida and Texas, and a 31% chance she wins one of them. Conversely, there is a 24% chance that Trump wins one of New Hampshire or Minnesota, and a 14% chance he wins both.
The point is that very strange events can happen. And when pollsters all weight their samples to a group of common factors (including recalled vote, which can act as a very strict proxy for partisanship), the potential for an industry-wide miss spikes. To be clear, we’re not expecting one on election night — we still think it’s a very close election. But we also wouldn’t be surprised by a Harris blowout, or by a Trump win exceeding his 2016 margins.
If either of those cases were to happen, you’d see a lot of shocked faces. So perhaps it’s worth remembering that despite the picture of stability that all models paint about this race, it’s actually arguably more likely than not for “weird” things to happen.
Senate

In the race to control the Senate, the GOP fundamentals continue to reinforce a clear Republican advantage, as our latest forecast gives Republicans a 73% chance of winning a majority. While recent polls have given Ohio Senator Sherrod Brown a boost, placing him as the narrowest of favorites in the tossup column, Montana Senator Jon Tester continues to trail Republican candidate Tim Sheehy. The GOP has an 82% chance of flipping the seat in the latest model.
If Democrats lose Montana, they would need to flip a seat in another state while holding Ohio to have a chance at holding the Senate. The most likely candidates here are Texas and Florida (both of which are probably better bets for Democrats than Montana is at this point). Incumbent Senators Ted Cruz (TX) and Rick Scott (FL) are both fairly controversial and have poor approvals in their state, and some recent polling shows tight races in both states.
In Texas, Democratic Rep. Colin Allred has significantly closed the gap in polling, but a relatively even vote share with the top of the ticket makes it unlikely that he generates the ticket-splitting necessary to actually win. With an onslaught of late Republican cash hitting the state, Allred will see his spending advantage greatly reduced. While this does not make a victory impossible, it does make it improbable, and our model actually thinks this is likely to limit his potential to catch up to Cruz in polling.
Similarly, former Florida Democratic Rep. Debbie Mucarsel-Powell is running a strong race, but still trails in the polls by a slightly larger margin than Allred in Texas. For either race to flip to Democrats it would require a polling error against the GOP, and while this certainly could happen, it’s not exactly a scenario that a party should hope to find themselves in.
Lastly, the Nebraska regular Senate election has caught the eye of several observers, with virtually every nonpartisan poll now showing a close race. Incumbent Republican Senator Deb Fischer has always kept a low profile in Washington. Normally a lock for re-election in this safe-red state, Democrats in the state opted not to run their own candidate, instead quietly backing conservative-leaning independent Dan Osborn.
Osborn’s anti-corruption messaging painting Fischer as a creature of Washington seems to be working, with both candidates neck-and-neck in the polls even as Trump is expected to win the state easily. While we still expect a solid Fischer win, an Osborn overperformance now looks quite likely. Our model gives Osborn a 13% chance of beating Fischer, and he is very likely to outperform both Harris and Preston Love, Jr. (the other Democrat, running in the special election for Senate against Pete Ricketts).
Finally, Democratic resilience in the major swing states bears mention. Democrats remain substantial (although not assured) favorites to hold their seats in Michigan, Wisconsin, Pennsylvania, Nevada, and Arizona. While Trump remains quite competitive in all five, polling continues to show consistent leads for Senate Democrats. Republicans are hopeful that their candidates will draw closer to the top of the ticket as Election Day nears, but they may be running out of time.
House

With just over four weeks left until election day, the battle for control of the House is reaching a fever pitch. Our model gives Democrats a 56% chance of winning the chamber — down from 61% last week, driven mostly by newly added generic ballot polls that show a bit of slippage (their lead is now down to D+1.7, which is the closest it has been in some time, while Harris has lost about half a point of ground in national polling).
As of today, Democrats have the advantage in 211 seats, while Republicans are favored in 208. Sixteen seats are currently in the tossup column. Of these, we’re focusing on ten today that will decide control of the House in November.
Over the last month, Republicans have gained ground in AK-AL and ME-02. Both are Trump districts held by Democrats. In AK-AL, Mary Peltola is facing a rematch against Republican Nick Begich. Our model gives Peltola a 58% chance of victory as she retains a fundraising advantage over her opponent. The race tightened after the remaining GOP contenders dropped out, allowing opposition to consolidate.
In the GOP-leaning ME-02, meanwhile, this dynamic is reversed, as moderate Democrat Jared Golden is an underdog against Republican Austin Therieault, who now has a 56% chance of winning. GOP groups have outspent Democrats in the district. Things are also looking up for Therieault on the polling front, with a recent Pan Atlantic Research Poll showing him ahead 47-44%. This might well be Golden’s closest ever race, and while he’s certainly won handily before, we’re not so sure we’d be eager to bet on him here.
In WA-03, also a Trump seat, Democrats are holding up well. Democrat Marie Gluesenkamp Perez is narrowly favored to win a rematch against Republican Joe Kent. Democratic groups have spent more than their Republican counterparts here in recent weeks and Kent, a chronic WAR underperformer, appears poised to once again lose a Trump district. If Democrats do ultimately hold on in this seat, it could go a long way towards securing them a House majority.
In the Midwest, two battleground House seats are especially competitive: IA-03 and MI-07. The former, represented by Republican Zach Nunn, has seen substantial outside spending by both parties — particularly from the GOP. Nunn currently has a 53% chance of defeating his Democratic opponent, Lanon Baccam, in what could well be the closest race of the cycle. Republicans have slightly better odds in MI-07, which was the median House seat in 2022; while Democrats have a modest advantage in terms of outside spending, Tom Barrett remains slightly favored, with a 55% chance of winning against Democrat Curtis Hertel.
Finally, we come to California. Democrats currently have the advantage in three of the four seats on our list: CA-22, CA-27, and CA-45. Of these, their lead in CA-45 is the most tenuous. Democrat Derek Tran has just a 51% chance of beating Republican Michelle Steel. Perhaps better for Republicans in the long run is CA-22, where David Valadao has gained ground in recent weeks. Rudy Salas currently has a 55% chance of beating Valadao in a rematch.
In CA-27, businessman George Whitesides retains a fundraising lead against Republican Mike Garcia. But the GOP has led here in terms of outside spending, and internal polling we’re aware of consistently shows no clear leader in this race. Our model suggests that you’d probably rather be the Democrats here, given the sheer partisanship of the district (Biden won it by double-digits in 2020, and Harris is likely to win it by mid-to-high single digits in 2024), but the winner here is likely to only eke it out by a thin margin.
It feels like a cop-out to say “this election is more likely than not to be close”. We know that’s something you didn’t necessarily need a model for. But that is simply the reality of where we stand, exactly one month out from election day. A Democratic House is only slightly more likely than a GOP one at the moment, and a Harris presidency is only slightly more likely than a Trump one.
One clear point of value models do have, however, is in showing just how little news events seem to matter, despite breathless coverage. Neither the first debate, the VP debate, the current hurricane response, the dueling endorsements from Taylor Swift and RFK Jr., nor the dockworkers’ strike seem to have appreciably moved the needle in either direction.
Perhaps these factors all matter less to voters than any of us want to believe.
I’m a computer scientist who has an interest in machine learning, politics, and electoral data. I’m a cofounder and partner at Split Ticket and make many kinds of election models. I graduated from UC Berkeley and work as a software & AI engineer. You can contact me at lakshya@splitticket.org
My name is Harrison Lavelle and I am a co-founder and partner at Split Ticket. I write about a variety of electoral topics and handle our Datawrapper visuals.
Contact me at @HWLavelleMaps or harrison@splitticket.org
I’m a political analyst here at Split Ticket, where I handle the coverage of our Senate races. I graduated from Yale in 2021 with a degree in Statistics and Data Science. I’m interested in finance, education, and electoral data – and make plenty of models and maps in my free time.
I make election maps! If you’re reading a Split Ticket article, then odds are you’ve seen one of them. I’m an engineering student at UCLA and electoral politics are a great way for me to exercise creativity away from schoolwork. I also run and love the outdoors!
You can contact me @politicsmaps on Twitter.
I am an analyst specializing in elections and demography, as well as a student studying political science, sociology, and data science at Vanderbilt University. I use election data to make maps and graphics. In my spare time, you can usually find me somewhere on the Chesapeake Bay. You can find me at @maxtmcc on Twitter.