

For Americans, the “suburbs” have traditionally evoked images of cookie-cutter houses on sprawling roads, housing families with parents commuting to 9-to-5 jobs in nearby cities. Suburbs are also synonymous with a certain kind of prosperity and political power — two things that were, for many years, mostly exclusive to white Americans.
But a look at the data finds that the traditional “white flight” suburbs are changing. Split Ticket took the 100 largest “predominantly suburban” counties in 2020 and examined their political and demographic changes over the past 20 years. The counties used for this project were selected in order of population, and are “predominantly suburban.” To be eligible, a county must be in a metropolitan or combined statistical area but cannot contain an urban core. These criteria exclude several counties, such as Maricopa County in Arizona, that contain both an urban core as well as most of the region’s suburbs.
These counties range in size from gargantuan Orange County, California, with a population exceeding 3 million residents, to Rockingham County, New Hampshire, with 314,000. Collectively, they are home to over 20% of the American population, and are incredibly influential in the political realm, hosting dozens of the nation’s most competitive races and comprising a decent chunk of the vote in swing states.
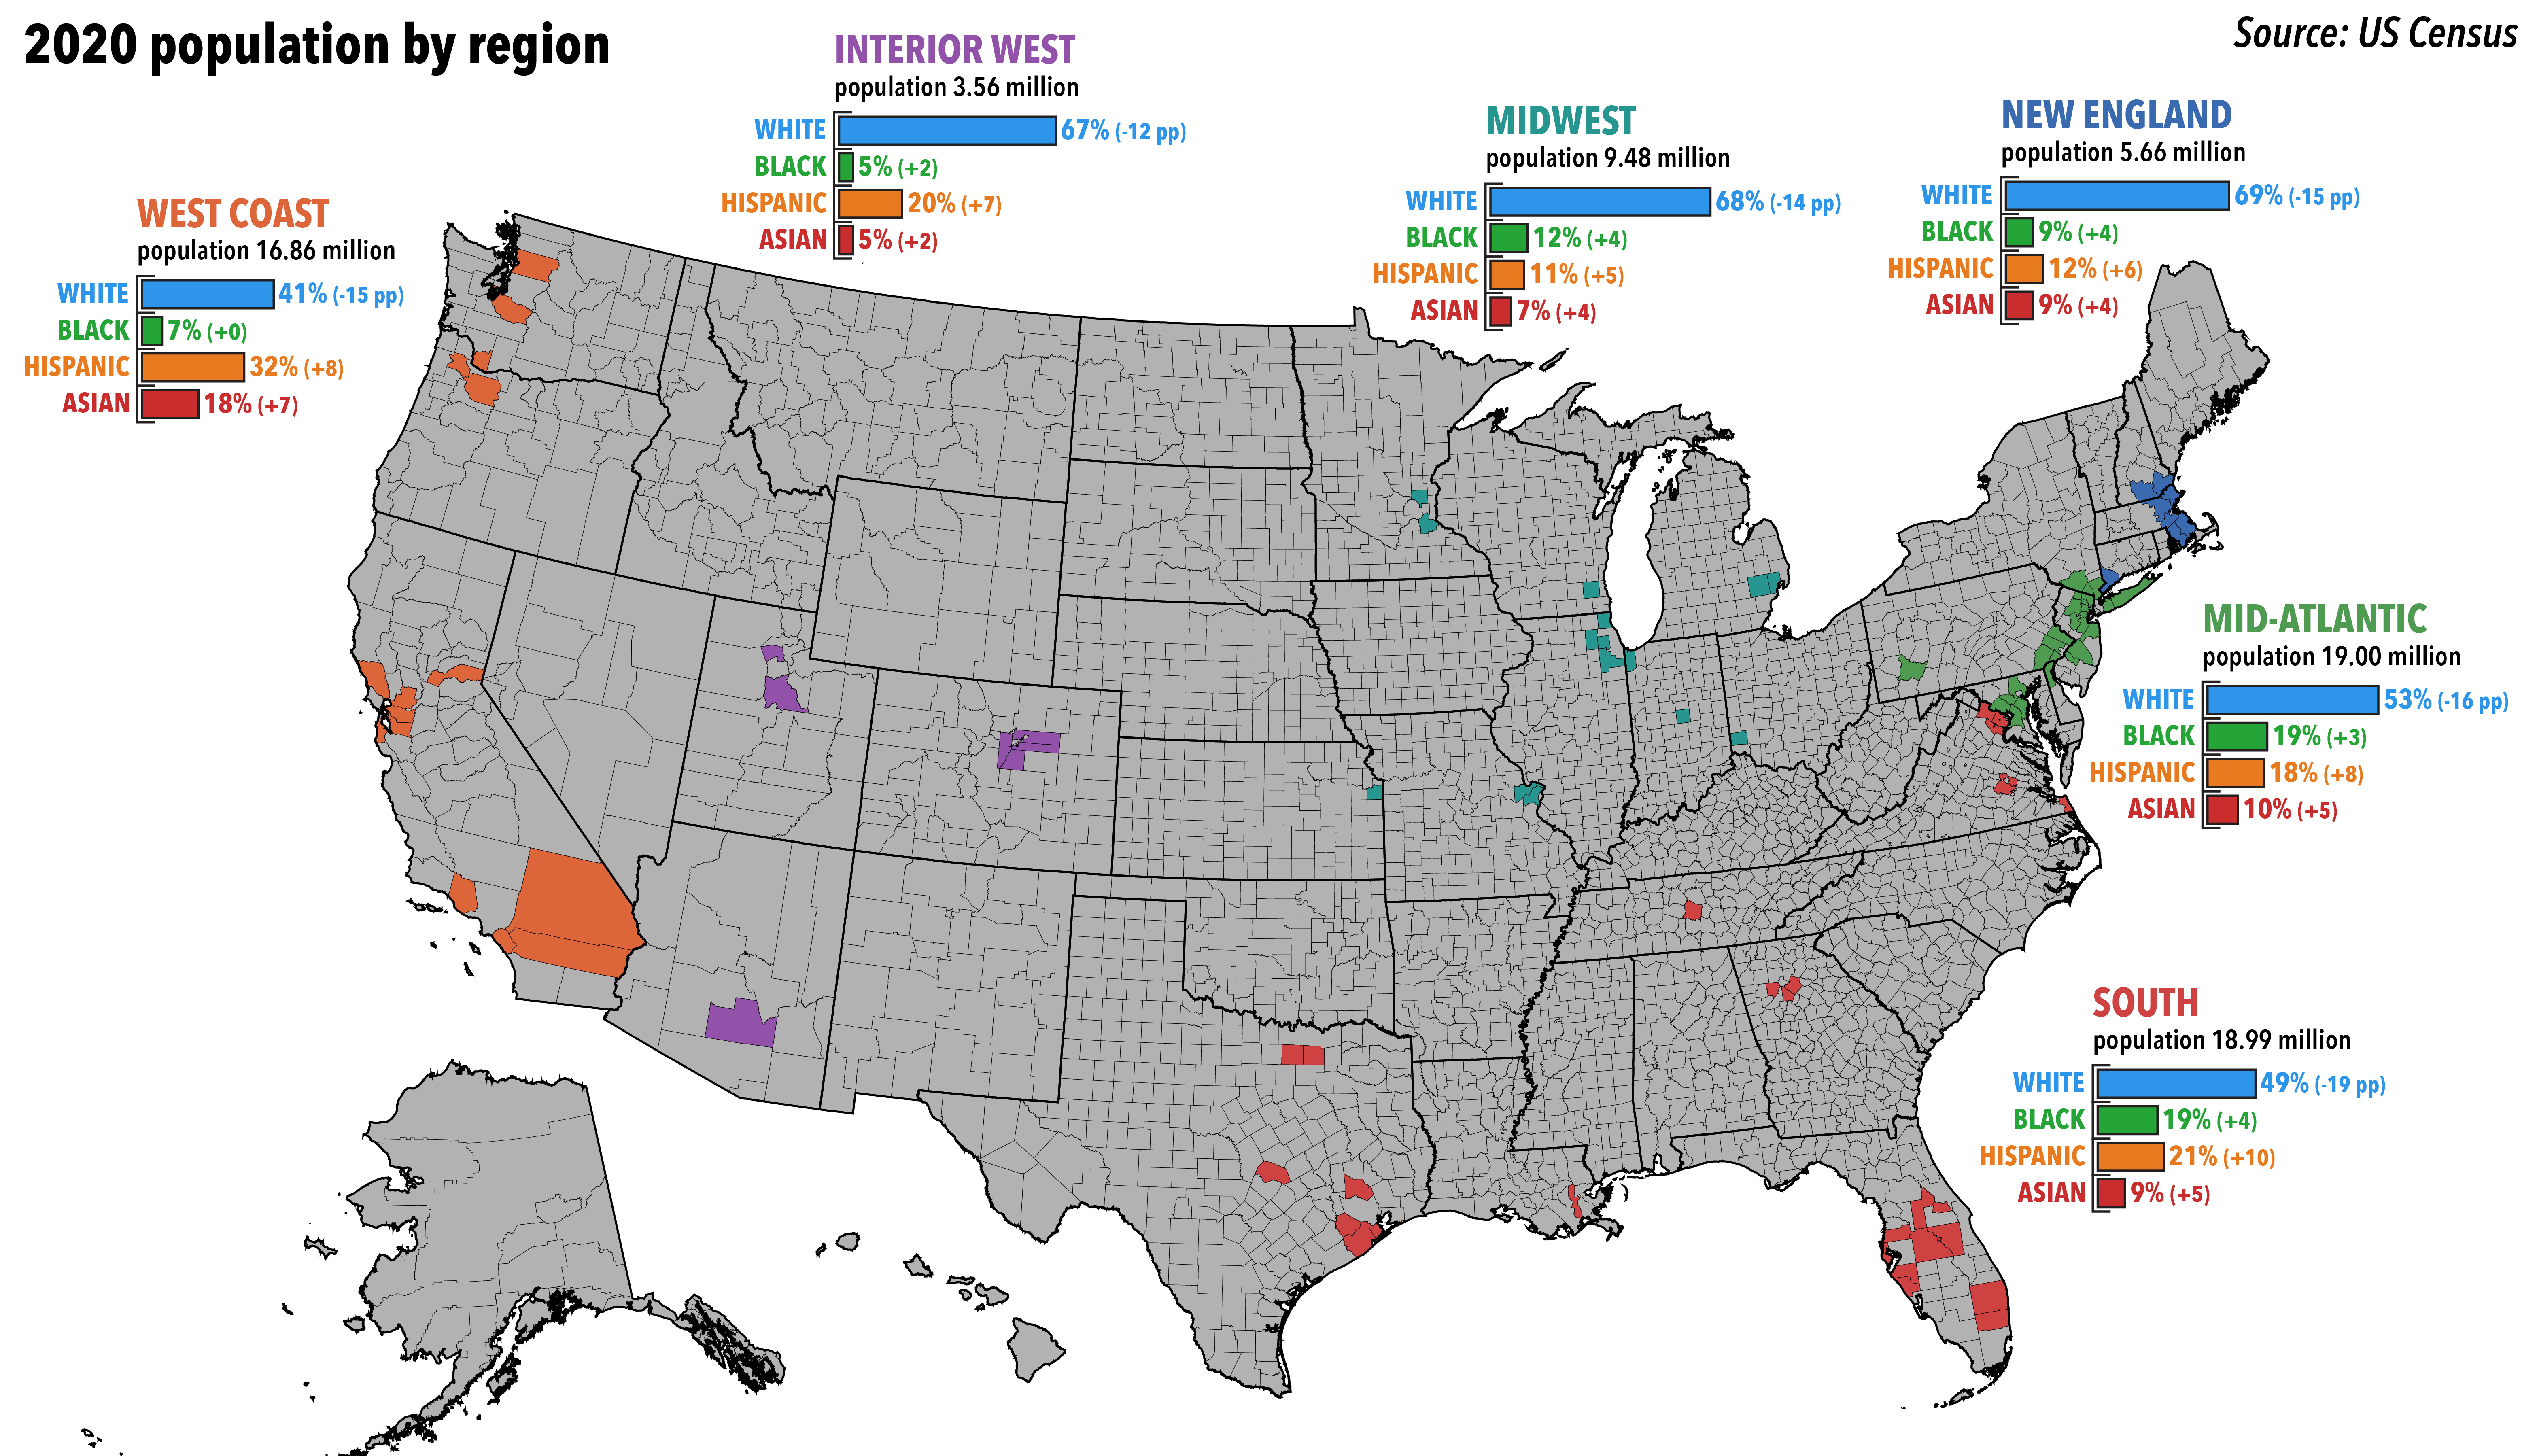
The shift has been striking; in 2000, these counties were nearly 70% white. In 2020, they were down to just 53% white, and there is a strong chance they will be majority-minority sometime this decade—if not already.
The shift in some rapidly growing and diversifying counties was even starker. Outside of Atlanta, for example, Gwinnett County transformed from a 67% supermajority-white county to a veritable melting pot, at 33% white, 30% Black, 23% Hispanic, and 14% Asian.
These demographic changes, along with shifts in political coalitions along educational lines, have pushed the suburbs toward Democrats. The vast majority of these counties are large, well-educated, wealthy, and in major metropolitan areas. Not long ago, many of them were Republican strongholds, but they have since become a substantial part of the Democratic base – 26% of 2020 Biden voters live in one of these counties.

A defining characteristic of these suburbs has been their massive growth. Collectively, these counties have grown +24% since 2000 and have gained over 14 million people. Just three counties have lost population: Westmoreland County in Pennsylvania, Jefferson Parish in Louisiana, and St. Louis County in Missouri. Many have added hundreds of thousands of new residents, the largest of which is Riverside County, California, which has added 873,000 people over the past 20 years.
The Interior West and the South in particular stand out, having grown +52% and +46% respectively. In raw numbers, the Southern counties lap every other region, having grown by nearly 6 million and placing them an inch behind the largest region, the Mid-Atlantic, with both having populations of 19 million.
The South has also seen the greatest decline in the white percentage of the population, joining the West Coast in being majority-minority. Southern metropolitan areas such as Atlanta, Dallas, or Houston, are home to suburban counties that are both growing and diversifying at an incredible pace. In 2000, Texas’ Collin County was home to 491,000 people and was 76% white, the definition of a wealthy, white southern suburb. Nowadays, it remains both wealthy and educated, but has a population of 1.1 million and is teetering on the edge of becoming majority-minority, with an Asian population nearing 20%.
The West Coast’s suburbs have long been the most diverse of the regions; they were the only ones to be under 60% white in 2000, and in 2020 they were just 41% white. The region boasts both the highest Hispanic percentage (32%) and Asian (18%), and its raw population growth of 3.4 million outstrips all other regions but the aforementioned South.
Even places that were very white in 2000, and remain so to this day, have often seen substantial diversification. New England’s suburbs, for example, remain the whitest region at 69%, but that still represents a 15 percentage point decline from 2000.
Of course, the non-white groups that make up increasing shares of the population are not all evenly distributed. Hispanics and Asians, for example, are two of the fastest growing populations in the United States. Indeed, in most of the suburban counties listed here, the groups with the largest percentage point increases in their shares of the population are Hispanics and Asians. This does not necessarily mean they are the largest nonwhite group in any particular county, but only that they saw the largest increase overall.

There are some visible trends in the data. Asian growth is concentrated in wealthy, highly educated suburban counties. Hispanic growth is fairly well-distributed, but tends to show up the most in the largest metropolitan areas, such as Los Angeles, Chicago, and New York, all of which are home to increasingly large Hispanic populations. Black population growth is most likely to occur in suburban counties near heavily Black cities, such as Atlanta, St. Louis, or Baltimore.

Since 2000, the white population share in every suburban county in our dataset has declined — in many cases by a substantial percentage. This significant demographic shift, accompanying large population gains, has broadly led to corresponding improvements in Democratic vote share. In 2020, for instance, Democrat Joe Biden won six of our seven regions, including four by double digits. Even the Interior West, the most consistently Republican region in the dataset, came within a percentage point of backing Biden. While the Democrats currently dominate in this cutout of suburbia, winning it overall by 17 points overall in 2020, it wasn’t always like this. There have been a number of interesting differences across regions along the way, many of which can be explained by the pace and nature of demographic change in the regions’ leading counties.
Our top 100 suburban counties have consistently voted to the left of the nation as a whole, but the gap hasn’t always been particularly large. In fact, before Donald Trump’s entry into the American political arena, these counties were consistently voting only around 5 points bluer than the national popular vote. This modest Republican floor was best exemplified by George W. Bush, who in 2004 became the most recent Republican presidential candidate to win the national popular vote. Coming within three points of winning them collectively in 2004, Bush remains the best performing Republican in the 21st century in collection, both in terms of raw margin and margin relative to the nation.
Democrats improved their margins significantly in these counties with the ascendance of then-Senator Obama to the White House, with the 44th president winning them by double digits in both of his elections. Nevertheless, relative to the nation, Republicans held their own. John McCain, for instance, lost them by 13 points in 2008 but given Barack Obama’s 7-point national popular vote win, the counties collectively clocked in at just under 6 points left of the nation as a whole—fairly close to Bush’s adjusted performance in 2000 and 2004.
The Republican floor fell significantly in 2016, though, when a number of our suburban counties which had backed Mitt Romney in 2012 flipped to Hillary Clinton. While Trump lost the suburban collective by the same margin as McCain had eight years earlier, the narrowing of the national popular vote meant that the top 100 suburban counties voted 11 points to the left of the nation as a whole—nearly twice as blue after adjustment as in 2008. The story was similarly grim for Republicans in 2020.

Bush in 2004 was not only the best-performing Republican in the region collectively, but also had the best performance for a 21st-century GOP nominee by unadjusted margin in five of the six individual regions. The only exception is New England, where Mitt Romney in 2012 lost by only 16 points—just under 2 points less than Bush’s performance in 2004. This outlier can probably be attributed to Bush’s relative unpopularity in New England, a phenomenon exemplified by the behavior of New Hampshire, which was the only Bush-Kerry state of the 2004 cycle.

By adjusting raw margin to account for the national environment and then measuring the shift between cycles, a metric known as a trend, fascinating regional strengths (and weaknesses) of certain presidential nominees are revealed. Between 2004 and 2008, for example, Republicans improved by 7 points in New England using this method. This might be partially attributable to Bush’s unpopularity in New England, but is probably due to the absence of Kerry, a Massachusetts native, from the ballot.
In 2012, the Interior West and Midwest moved more visibly towards Republicans than any other region. This can be explained by Romney’s general improvement over McCain relative to the national climate in the Rust Belt region, where Obama absolutely dominated in current swing states like Michigan and Wisconsin. A similar rebound was not observed in the West Coast region, which moved slightly more to the left relative to 2008.
In 2016, Republicans lost ground across every region—a reflection of Trump’s general lack of appeal to many swing voters in the top 100 suburban counties; the Interior West, New England, and the West Coast all had adjusted shifts of more than 8 points towards the Democrats. Nevertheless, regional nuance could still be observed. In the Mid-Atlantic region, for example, Trump performed almost as well as Romney had in 2012 after adjusting for the national environment, with a Democratic shift of just 1 point.
Overall, the suburbs have been an unequivocal positive for Democrats of late. While increasing minority populations have not been universally correlated with improvements for Democrats in the top 100 suburban counties, the party has made consistent gains each cycle at the regional level.
The past is not strictly predictive, however, and the suburban counties across these six regions will almost certainly play a significant role this November in electing either candidate to a second term. While as a whole, they are likely to remain in the Democratic column, any substantial slippage from Biden with suburbanites could very well manifest here in the form of Trump gaining net votes. In a close election, that could make the difference.
I am an analyst specializing in elections and demography, as well as a student studying political science, sociology, and data science at Vanderbilt University. I use election data to make maps and graphics. In my spare time, you can usually find me somewhere on the Chesapeake Bay. You can find me at @maxtmcc on Twitter.
My name is Harrison Lavelle and I am a co-founder and partner at Split Ticket. I write about a variety of electoral topics and handle our Datawrapper visuals.
Contact me at @HWLavelleMaps or harrison@splitticket.org