At Split Ticket, we have repeatedly proven that candidate-driven effects fundamentally impact election results, but we have not completely addressed a more controversial question: do ideologically-extreme candidates pay electoral penalties? Previous analysis on the correlation between moderation and overperformance suggests that they do. But it’s worth looking at how this holds up in 2022.
Note: The article and figures were refreshed on March 6, 2025 to account for Split Ticket’s revamped Wins Above Replacement methodology.
Is Electability Real?
The first question to answer is whether the notion of “electability” was empirically observable in the midterms. If so, overperformance in 2022 should be correlated with overperformance in 2020. This was the case between 2018 and 2020 and was the crux for our first ideological piece on the notion of electability, before our WAR models were even developed. And indeed, on average, we found that roughly half of a candidate’s 2020 WAR (wins above replacement) score carried over into 2022.
The existence of this correlation across three straight cycles suggests that candidate “electability” is real and has a continuous impact. There are certain incumbents who are chronically weak electorally, such as Republican Alex Mooney of West Virginia (whose WAR across the 2018, 2020, and 2022 cycles was D+10, D+10, and D+9). On the other hand, candidates like Brian Fitzpatrick, a Republican whose WAR across the same three cycles was more than 10 points above replacement for all three cycles, have candidate-specific electoral strengths that make them much stronger than any generic candidates would be in the same seats.
The next question for us, of course, is what drives this type of overperformance, and whether it can be linked to ideological stances. To properly assess this, we used two methods. First, we compared overperformance (quantified by WAR) to the ideological lean of members’ congressional votes, as measured by Voteview’s DW-NOMINATE. We then gauged how members of specific Congressional caucuses tended to perform, on average.

In the above chart, positive numbers on the ideology axis are associated with more conservative votes and negative numbers with more liberal ones. Our data shows that there was a significantly stronger correlation between ideology and electability for Republicans in 2022 than there was for Democrats, as shown by the stronger tilt of the confidence ellipses — the closer to the center a Republican incumbent was, the more likely he or she was to overperform.
Our visualization does suggest that ideologically-extreme Republicans paid a greater average penalty in 2022 than their Democratic counterparts. However, vote-based ideological conservatism had a minimal correlation to Democratic overperformance. It was, in fact, slightly negatively correlated with Democratic WAR.
The implications of this are interesting. There is a case to be made that persuadable voters simply found the policy goals of progressive Democrats (Congressional Progressive Caucus) more tolerable than those of right-wing populist Republicans (House Freedom Caucus) last year. But there is one important caveat here: progressives who kept voting against Democratic priorities pushed by President Biden are marked as “conservative” by DW-NOMINATE for voting in line with the Republican opposition.
This skews the assessments for Democrats, because what DW-NOMINATE is arguably really scoring here would be how frequently a Democrat voted with President Biden. For example, members like Alexandria Ocasio-Cortez, Cori Bush, and Ilhan Omar are scored as conservative Democrats because they voted to oppose key tenets of the Biden agenda, such as the bipartisan Infrastructure Investment and Jobs Act.
It is not accurate to classify any progressive Squad members as conservative, though, because their opposition was primarily directed at legislation which they considered insufficiently progressive. Thus, while DW-NOMINATE gives us a good heuristic for how centrism correlated with overperformance for House Republicans, it doesn’t tell us much about its impact for House Democrats. We pose another question to get around this issue: how did the median members of different ideological groups perform?
The Electoral Strength of House Factions
We examined six House factions: the Problem Solvers Caucus, the Blue Dog Coalition, the Congressional Progressive Caucus, the New Democratic Coalition, the Freedom Caucus, the Squad, and the “MAGA Squad” (a subsection of the Freedom Caucus’ most right-wing Republicans). Before we go on, there are a few caveats worth noting regarding our caucus selection process.
First, members of the caucuses listed above are only counted below if they served in the last Congress and had contested reelections in 2022. Second, we excluded the Republican Mainstreet Partnership because it ceased to be a caucus in February 2019. We measured the average strength of more centrist Republicans based on those participating in the bipartisan Problem Solvers Caucus.

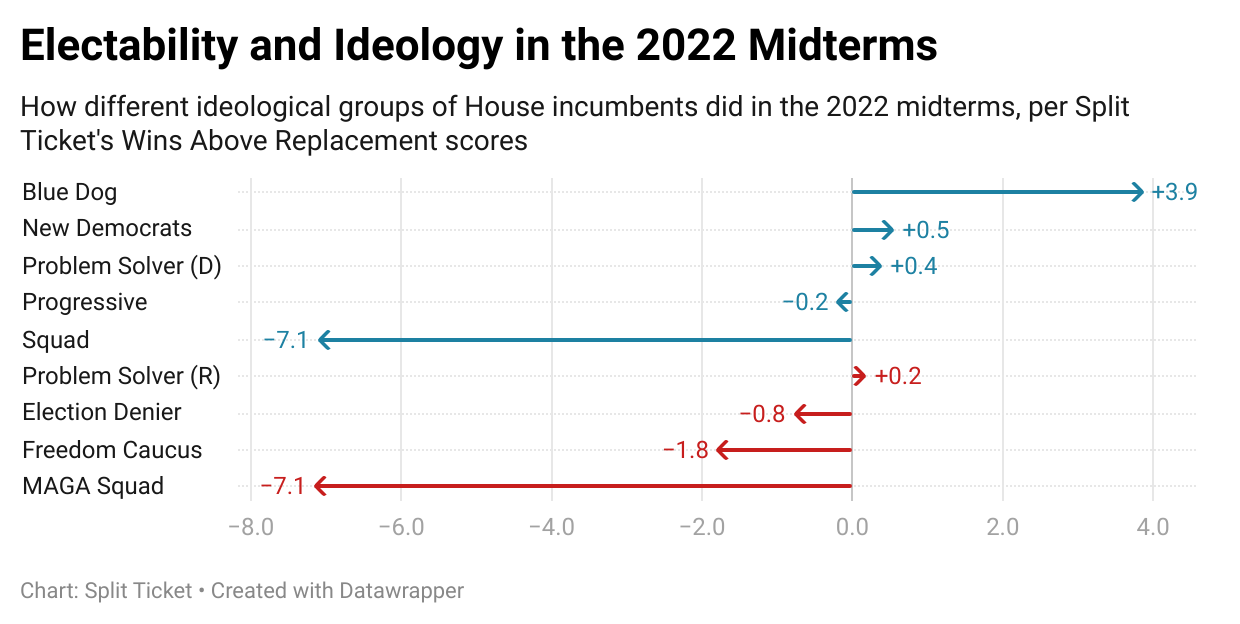
The WAR for each congressional faction; Republican caucuses are colored red, while Democratic caucuses are colored blue.
Contrary to what intuition may suggest, the median WAR scores for both the Congressional Progressive Caucus and the Democratic members of the bipartisan Problem Solvers caucus were not too far apart (-0.2 vs +0.4), indicating that ideological differences between the two groups may not have been significant enough to result in any major divergence in performance in this cycle.
And the New Democratic Caucus members didn’t do much better (+0.5) than their counterparts in the Congressional Progressive Caucus (-0.2). For all the ink spilled on the approaches of each group, these differences are simply not very large. Combined with the ellipse plot we showed above, our approach hints at something fascinating: for Democrats, in 2022, there was minimal correlation between electability and ideology within a certain ideological range. Only the most extreme and most moderate candidates had any clearly visible, notable effect.
But at the extremes, where that effect was present, it was extremely clear and obvious. The Blue Dog Coalition, home to the most centrist House Democrats, had an average WAR of +3.9, making it the strongest Democratic caucus electorally. The ultra-progressive Squad, meanwhile, had a whopping -7.1 WAR underperformance on average, which was the largest of the Democratic factions examined. Not a single Squad incumbent overperformed last November, suggesting that Democrats also paid ideological penalties for extremism at a certain point.
It seems that voters were generally somewhat willing to accept progressive and mainstream Democrats alike, but still punished the leftmost extremes of the Democratic caucus and rewarded the most moderate members, in a continuation of themes observed in 2020.
On the Republican side of the aisle, extremist members were penalized as well. Unlike their centrist counterparts, the median Freedom Caucus WAR was -1.77, a clear GOP underperformance, and the “MAGA Squad” (Time Magazine’s list of the most ardent Trump loyalists in Congress) did the worst of the lot, with a 7 point underperformance; Trump’s most outspoken defenders in Congress like Lauren Boebert (CO-03), Matt Gaetz (FL-01), and Marjorie Taylor Greene (GA-14) posted some of the worst WAR scores in the whole House. The clear underperformance from these groups shows a striking penalty for extremism.
The WAR delta between the MAGA Squad and the Freedom Caucus, as well as the gap between the Squad and the Congressional Progressive Caucus, offers compelling evidence that beyond a certain point, voters begin to heavily punish ideological extremism.
Ex post facto election analysis is fraught with difficulty. At Split Ticket, we have proved that candidate quality plays a critical role in determining election outcomes. Instead of being seen as a subjective concept, electability should be grounded in hard facts. Our research suggests that ideological extremism had a detrimental impact on candidate performance in general, with a much more significant correlation between ideology and electability observed among House Republicans.
———
We hope you enjoyed this piece. If you did, please consider subscribing to get our articles delivered straight to your inbox — it’s free!
I’m a computer scientist who has an interest in machine learning, politics, and electoral data. I’m a cofounder and partner at Split Ticket and make many kinds of election models. I graduated from UC Berkeley and work as a software & AI engineer. You can contact me at lakshya@splitticket.org
My name is Harrison Lavelle and I am a co-founder and partner at Split Ticket. I write about a variety of electoral topics and handle our Datawrapper visuals.
Contact me at @HWLavelleMaps or harrison@splitticket.org