Over the last two presidential cycles, the Trafalgar Group rose to fame for its polling, which yielded better-than-average results for Republicans and indicated closer races for Donald Trump than many other outlets predicted. Trafalgar partly attributes those numbers to its “social desirability metric”, which the firm claims adjusts for respondents, especially conservatives, answering the way they believe the pollster wants them to answer.
Trafalgar became an outlier in 2016 and 2020 for suggesting that Trump had a better chance of winning both his elections than other outlets predicted. When Trump won in 2016 and lost by a smaller-than-expected margin four years later, the firm claimed vindication and was given plaudits by the media for it — in fact, FiveThirtyEight upgraded its pollster rating to A- after a retrospective analysis that found them to have the second-lowest average error of all pollsters in 2020.
While Trafalgar’s results may have given them increased credibility among both the general public and Republicans, they arguably have not moved the needle with pollsters, who remain deeply suspicious of the firm’s opaque methods. A deeper examination of Trafalgar’s polling actually suggests that its procedures differ substantially from those of other firms.
Yesterday, Twitter user Ding3rs flagged something interesting about the few methodological metrics Trafalgar did report in their polls. This lined up with a message Split Ticket had already received a few days ago from a man under the pseudonym of Michael Lee (Twitter). Both users noticed that Trafalgar kept obtaining an extremely consistent response rate in its polls, with virtually no variation in how frequently voters responded.
Before getting into the details, a brief technical explanation is worthwhile to contextualize the rest of the article. Most people who get called by polling agencies refuse to pick up the phone or engage with the pollster for the full survey itself. The percentage of people who actually complete a survey is called the response rate.
Let’s create an example. Imagine that one wants to conduct monthly polls with a sample of 1,000 voters. To accomplish this, one might need to contact 75,000 people the first time around — this yields a response rate of 1.33%, as 1 out of every 75 people responded to the hypothetical survey. The next month, 80,000 voters might need to be contacted, making the response rate 1.25%. And the month after that, only 65,000 voters may be needed, producing a rate of 1.5%.
The response rate traditionally varies by demographic. For instance, non-college white and Hispanic voters are significantly harder to reach and are much less likely to engage with surveys than are urban, college-educated voters. Similarly, young voters and independents are much more difficult to contact and therefore necessitate bigger sample sizes. There is significant variation by state as well — Georgia, for instance, with its heavy concentration of rural whites and minority voters, has a much lower response rate than Arizona, which has far more seniors with higher voting propensities.
Nate Cohn of the New York Times discussed the variance inherent to response rates as traditionally calculated in a written reply to Split Ticket.
“Our response rates vary greatly from poll to poll. They can vary depending on the demographic makeup of the sample, how we’ve stratified the sample, whether we’re calling fewer or more landlines, the quality of the telephone numbers on a state voter file, the day of the week, the time of the year, the length of the survey and more.”
The method used to contact voters for polls affects the response rate immensely as well. For example, phone calls will have different response rates from emails and text messages. Furthermore, as an election nears, voters often get saturated with calls and texts from pollsters, causing response rates to plunge.
Trafalgar uses six modes of voter contact, according to their website: live calls, integrated voice response, text messages, emails, and two “proprietary methods”. But an analysis of polls first compiled by Michael Lee and validated by Split Ticket shows that Trafalgar’s reported response rate is extremely consistent and, indeed, close to constant across 96 state and national polls conducted between October 2021 and September 2022.
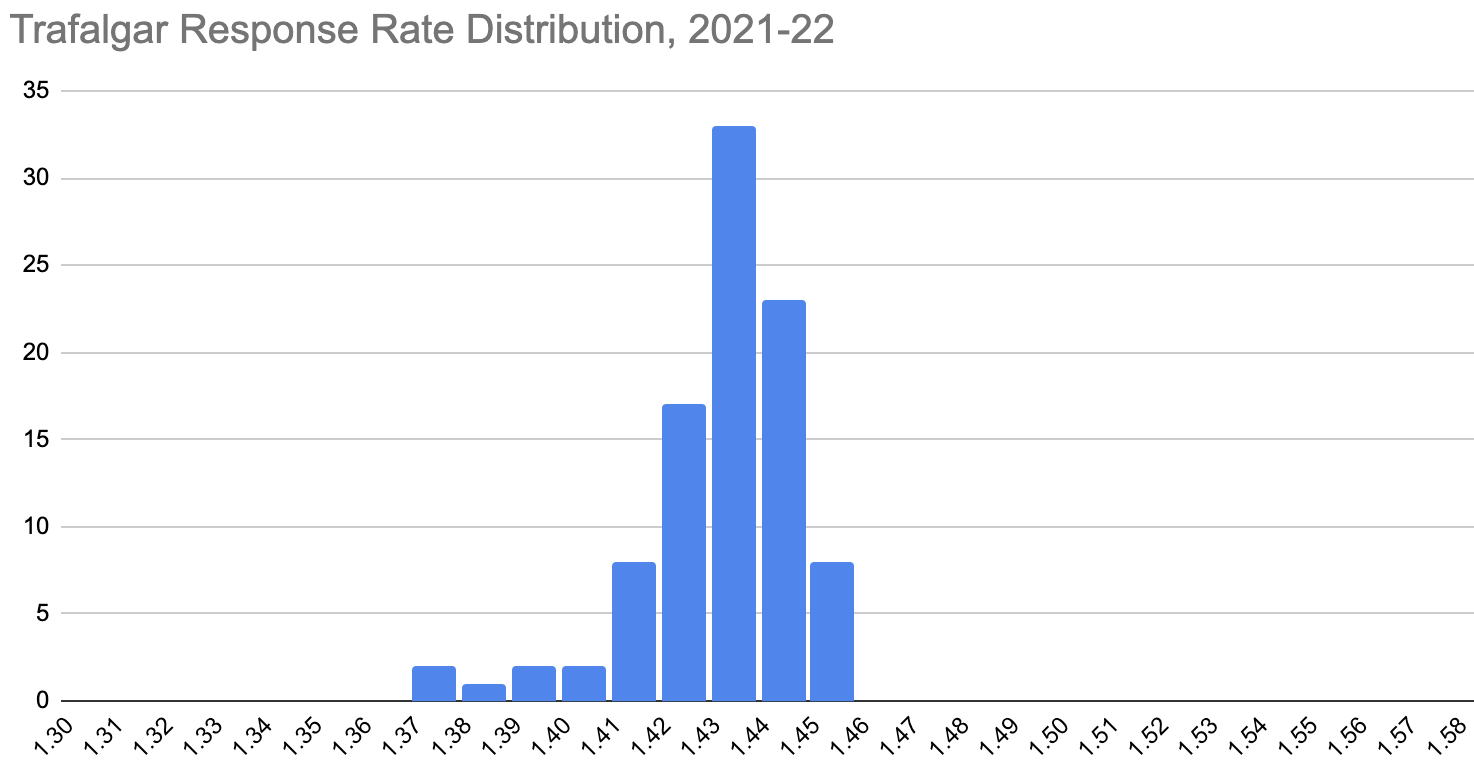
The distribution above suggests that Trafalgar gets a near-constant response rate for virtually every survey, regardless of the election type (primary or general), state, or the time of the year, despite using a variety of voter contact methods. In fact, in surveys conducted over the last 60 days, Trafalgar’s response rate has stayed between 1.43 and 1.46, despite polling primaries and general elections across a host of states.
This tight spread was not observed in 2016 Trafalgar polling. Back then, Trafalgar’s surveys of “1200+” voters in Michigan, “1100+” voters in Florida, and “1300+” voters in Pennsylvania had response rates of 3.59%, 3.21%, and 3.44%, respectively. In 2018, we were able to locate crosstabs for five polls, which had response rates ranging from 1.33% to 2.2%, showing variance that far exceeded anything seen in the 2022 cycle. That variance is much more in line with what was observed in data from other pollsters viewed by Split Ticket, and suggests that something has clearly changed recently.
Trafalgar’s opaque methodology significantly obscures the possibility for detailed outside analysis of their polling. However, it has not always been this way — at least, not to this degree. Their methodological statement in 2016 was much clearer about using IVR in Florida, and in 2018, they disclosed that they used a live caller and email blend in Indiana. Those have not been provided on any of the polls in this cycle, and neither the breakdown of voters who “lean” towards a candidate, the crosstabs of statewide polls, nor the regional participation by congressional district are present any longer.
So, the question naturally arises: what is Trafalgar doing? Is it possible that they are doing something that the industry simply refuses to use? In an interview with Robert C. Cahaly, founder of the Trafalgar Group, the pollster discussed some of his techniques with Split Ticket.
“How we pick our likely voters is something we take a lot of pride in. We do a lot of research on people before calling them, and look at their voting history to see how frequently they participate. […] Usually, our pool is about 75,000 people that will be contacted. We found that, knowing where we need to go, if we do that right, we get the sample we need. Remember that because some of our methods, like email or texts, come with a deadline, there are a lot of responses that come after the deadline [which then are not counted].”
Cahaly also suggested that sometimes, if the desired sample size was reached ahead of schedule, the “deadline” for responses might not matter, and mentioned that the survey could presumably be cut off early too if the targets were hit.
Essentially, examining the response rate for Trafalgar, which was the red flag tracked by many lately on Twitter, may be slightly misleading. This is because the firm first picks a pool of voters to contact, sets a rough target sample size that they want and contacts a set number of voters per poll until they get enough responses in a sample that they feel is representative.
With other pollsters, the voter contact pool is often of a dynamic size and may change depending on the response patterns observed, as discussed in the example constructed at the beginning of the article. For Trafalgar, however, the voter contact pool is usually fixed, and they repeatedly ping voters from that specially-selected pool until they obtain the desired sample, and then divide the sample size by the contact pool size (75,000 in this case) to calculate response rate.
This is rather different from the methodology of many other firms, and the method of calculating response rates may also be a shade different from the AAPOR definitions. But it is also why examining their reported response rates deeply on their own could be misleading.
Do these voter “pools” of 75,000 differ from poll to poll? According to Cahaly, this depends on the geography being polled, and he explains that “nationally, they tend to be very consistent, but state by state, they tend to [differ]”.
Interestingly, he claims, Trafalgar often doesn’t need more than a single outreach text to voters because of who they pick in their likely voter pool, the usage of live texting over text-to-web as one key mode of voter contact, and their stated forthrightness over the short length of the survey, which he claims boosts people’s willingness to take the survey.
“We don’t use text-to-web polling. We use back-and-forth texting [live text], which is much more expensive. We always let [participants] know how short it is. Let them know upfront how short it is, and participation is automatically higher. […] Because of the nature of the questionnaire, we [often] don’t have to send followup texts or emails. It’s enough the first time”.
This explanation does line up with the data that Split Ticket is aware of, in that shorter surveys do often result in higher response rates. Cahaly likens this to a real-world scenario.
“Imagine you were at the grocery store, and you had ten things in your cart that you didn’t need, and every line was 50 people. You might come back another day. But if there was a line that was just four, you might go ahead and check out. How long something is going to take is central to what we do every day in life.”
Do they weight their samples, as most pollsters do, to represent the electorate more fairly? Not much, according to Cahaly, who personally believes this introduces problems. ”Our goal is to do minimal, minimal weighting. When you weigh any population, you run the risk of not fairly representing their views.” In essence, once they obtain their sample, Trafalgar’s goal and practice appears to be that of minimal alteration.
Ultimately, the fact remains that Cahaly’s polls continuously give more Republican numbers than those from other polls. But by his reasoning, polls systematically underestimate conservative voters, because of what he calls the “shy Trump voter effect”. The theory is one that has been disputed by other pollsters and academics. Cahaly calls these pushbacks “nonsense”, however, and says that the pollsters disputing the effect “let what they want to exist dominate what does exist”. This, combined with their approach of repeatedly pinging a fixed and specially selected voter pool, would probably go some way towards Trafalgar’s more Republican numbers.
Polls struggled to reach Republicans (and especially low-propensity ones) to the appropriate degree in 2020. Thus, Cahaly says, they “had to work very hard to get those people to take polls. In many states, [the ratio] was four or five [Republican outreaches] to one [Democratic outreach]” in order to obtain a representative sample.
Does applying that general approach work in this cycle to the degree that it did in 2020? The jury is still out, and it will only be determined by the November results. If Republicans are truly more likely to answer the phone than in previous cycles, Cahaly’s approach may result in more Republican-leaning numbers than the true environment. Alternatively, if polls continue to overestimate Democratic support, Trafalgar’s polls could end up being much closer to the results once again, which is sure to spark a fierce methodological debate again.
Ultimately, Cahaly points to his results. “Remember the error rate”, he says, “and none of the other firms can compare”. Tracking whether that holds in 2022, especially given Trafalgar’s extremely different approach to polling, will be fascinating.
Editor Note (Sept. 19, 8:51 PM): This article has been updated to more explicitly state how response rate is seemingly calculated by Trafalgar and also link to the AAPOR definitions and standards.
I’m a computer scientist who has an interest in machine learning, politics, and electoral data. I’m a cofounder and partner at Split Ticket and make many kinds of election models. I graduated from UC Berkeley and work as a software & AI engineer. You can contact me at lakshya@splitticket.org
Michael Lee
I’m a political analyst here at Split Ticket, where I handle the coverage of our Senate races. I graduated from Yale in 2021 with a degree in Statistics and Data Science. I’m interested in finance, education, and electoral data – and make plenty of models and maps in my free time.
My name is Harrison Lavelle and I am a co-founder and partner at Split Ticket. I write about a variety of electoral topics and handle our Datawrapper visuals.
Contact me at @HWLavelleMaps or harrison@splitticket.org