No state inspires emotionally-charged and heartbreak-filled political discourse quite like Florida does. Democrats have lost every top-ticket race since 2012, often by the thinnest of margins, and in 2020, the vaunted lurch rightward of virtually every major demographic in the state (apart from select groups of suburban college-educated whites) shocked observers. Soon after, Republicans finally gained an edge in voter registration after a 140-year period of Democratic dominance, confirming the new reality: the once-purple Florida is now a red state.

Florida’s geography can be most easily reduced to a Republican-leaning north, a Democratic-leaning south, and then a historically purple but reddening midsection. Recent trends of educational and cultural polarization have complicated this a little bit, with Republican strength improving in the three core Democratic counties of Palm Beach, Broward, and Dade, while Democrats are improving in Orange, Duval, Leon, and Escambia counties.
Florida’s political dynamics are especially interesting because of the relatively high transience of its population — each election adds thousands of new voters who come from outside of the state, bringing their politics with them. One widely circulated theory regarding Florida’s recent swing right is a self-sorting mechanism that makes Florida transplants significantly more conservative than the surrounding population. So as an experiment, Split Ticket has devised a methodology to test what the net partisan effect of living in Florida has on voter choice.
The first step in answering this question is figuring out what counties outside the state of Florida are more similar to counties inside the state of Florida. For this, Split Ticket built an algorithm that compares demographic characteristics to see what the most similar counties is. These factors include race, religion, education, income, density, and a few other demarcating traits. As an example, here is a list of the 10 counties most similar to Jefferson County in northern Florida.
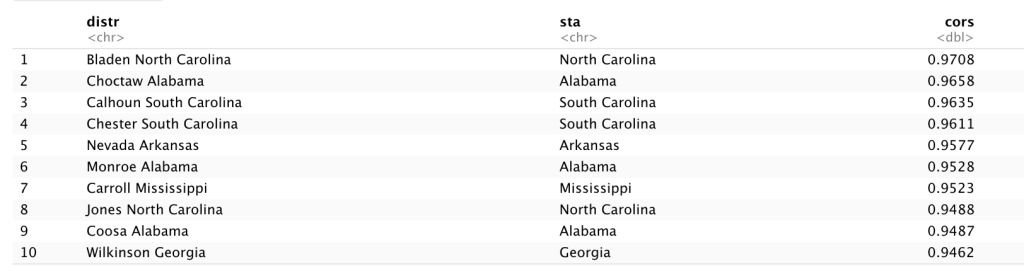
The first column has counties, the second the states they belong to, and the third column ‘cors’ refers to the similarity score when compared to Jefferson County. All of these, without exception, are rural counties with sizable black populations. A simple gut check heuristic confirms this as likely accurate. Partisanship wise, a list of counties is below:
Bladen, NC: 57-43 Trump (97.1% similar)
Choctaw, AL: 58-42 Trump (96.6% similar)
Calhoun, SC: 52-47 Trump (96.4% similar)
Chester, SC: 55-44 Trump (96.1% similar)
Nevada, AR: 64-32 Trump (95.8% similar)
Monroe, AL: 58-42 Trump (95.3% similar)
Carroll, MS: 69-30 Trump (95.2% similar)
Jones, NC: 59-40 Trump (94.9% similar)
Coosa, AL: 66-33 Trump (94.9% similar)
Wilkinson, GA: 56-44 Trump (94.6% similar)
Jefferson in Florida voted 53-46 Trump, so the vast majority of demographically similar counties are confirmed to be roughly similar, partisanship-wise.
The next step is to take the 2020 presidential partisanship for each entry in the list of counties above and weighting them by their similarities to produce a composite estimate of Democratic vote share*.
For Jefferson, this number works out to 42.4 percent as an estimated vote share for the county based on demographically similar areas across the nation. This makes sense given that it is both only 32% black and that the white population is a little bit more historically Democratic in Jefferson than in other parts of northern Florida.
Thus, using this method on all 67 counties in Florida, the following map is what 2020 partisanship in the state “should” have looked like, if not for state-specific and self-selection effects in Florida.

Notably, the topline is not that much more Democratic than it was in real life. Trump won the state by 3.4 points, and here it is Republican leaning by 2.8 points. The delta between predicted and actual is interesting and reveals some fascinating stories about where each party has residual strength that may fade with the increasing nationalization of politics.

This map shows where the 2020 election was more Democratic or Republican than predicted. First, for the Democrats, this confirms that much of central Florida still has white working-class voters voting blue in counties like Pinellas, Polk, and Volusia — something which may not hold in the future.
Secondly, rural counties like Osceola and Gadsden where Democrats depend on minority voters, are ripe to swing rightwards. Osceola in particular, is home to a large Puerto Rican population whose strongest analog are the rural Latinos along the Mexican border further west. Those counties have lately seen sharp swings rightward. Gadsden is 53% black and 11% Hispanic, and rural black populations have been declining virtually everywhere nationwide, so we would “expect” further turnout issues to lower the Democratic margin there.
Third on the list is cattle country — much of inland southern Florida is heavily white and heavily low-education, but still votes much more Democratic than it “should”. A high Hispanic population in theory would help Democrats but seeing as many are in the agriculture industry and lack citizenship this does not help, and in many cases, further polarizes white voters into voting Republican (see: California’s Central Valley).
For the Republicans, the biggest one is Miami-Dade County. Trump famously earned 200,000 votes more than he did in 2016, while Biden mostly maintained Hillary’s raw vote totals. Democrats, if Miami acted like the rest of the country, Biden “should” have won the county by a bit more – not enough to win the state, but likely enough to help downballot. One reason for this is that Miami has the largest concentration of heavily Republican Cuban-American voters anywhere in the country. Dade’s closest analogs are demographically similar by being heavily Hispanic but under the hood contain more Democratic-leaning Hispanic subgroups.
The second is the southwest coast, particularly Collier County. This area is the heart of the Florida GOP, and it is fairly high in college education. It is a lot more Republican than it “should” be – Collier voted for Trump by 25, but we would expect Biden to win a county with its demographics outside the state of Florida. Additionally, the Jacksonville area is particularly more red-leaning than it ought to be, notably in suburban Clay and St. Johns counties.
The third standout here is the northwest coast, home to the reddest part of the state. Culturally more similar to Alabama in many ways, all but one county (Jackson) west of the Apalachicola River is more Republican than it “should” be, particularly the stretch between Escambia (Pensacola) and Bay (Panama City). This area is home to beach towns and military bases, and has been moving leftward at a fairly strong clip for the past decade or so. Outside of Florida, we would expect counties demographically equivalent to Santa Rosa and Okaloosa to give Democrats above 35% of the vote, when in many cases they struggle to get above 25% here.
Florida is a very interesting state to analyze politically because the diverse set of transplants bring very different politics to very different areas. The Big Bend region has some of the smallest residuals between actual and predicted because most of the people moving into the state in that region are heavily Republican white southerners. Meanwhile, retirees from the Midwest and Northeast tend to move further central or south, and Dade/Broward counties are home to countless emigré populations from Central and South America. Even if Florida stays as a stubbornly red state, all of this amounts to one conclusion: the continual stirring of the melting pot will yield interesting changes under the hood for some time to come.
*This is done by generating the top 25, and then using the L5-norm correlation coefficients as weights to multiply each county’s Democratic vote share. The L5-norm simply means raising each correlation coefficient to the power of 5, and then dividing all by the sum of those raised numbers – to normalize the coefficients to sum to 1. This way, weighting is very simple.
I’m a political analyst here at Split Ticket, where I handle the coverage of our Senate races. I graduated from Yale in 2021 with a degree in Statistics and Data Science. I’m interested in finance, education, and electoral data – and make plenty of models and maps in my free time.