
Over the course of this election cycle, perhaps no single demographic has received more attention than young voters, which many polls now suggest to be increasingly Trump-curious. This has been observed alongside a similarly shocking swing toward Biden among elderly voters. If these surveys are correct, then our political landscape would be undergoing an incredible, unprecedented age-based shift in public opinion, despite 2024 being a rematch election in a period of record polarization.
To better understand and test this notion, we conducted two surveys. The first was a small, but focused, poll of 255 young voters, weighted by race, gender, and partisanship to be representative of the age group, with respondents probabilistically sampled from a voter file and interviewed, crucially, via live texting.
The second was a national poll of registered voters with a youth oversample, done through an opt-in web panel. This non-probability methodology is an increasingly prevalent way of conducting polls — organizations like YouGov, Data For Progress, and Morning Consult use these types of panels. As online opt-in panel methodologies have gotten more popular, their proponents have pointed to their strengths: quick field times, large sample sizes, more diverse respondents, and (of course) lower costs.
But these methodologies may also have pitfalls, especially because they compromise the basic tenet of probability-based sampling (that every individual in the population has an equal probability of being in the sample) and the anonymity of their respondents may yield poorer-quality data. We decided to do this analysis in order to compare this non-probability methodology to our (probability-based) voter file study conducted via live text.
This latest poll was fielded between March 25th and 28th, had a sample size of n=847 registered voters and a margin of error of ±3.37%, and was weighted by race, gender, region, age, education, and 2020 vote. To facilitate proper analysis of the youth vote, we oversampled young voters (n=300) in this survey and weighted the oversample internally by race, gender, education and 2020 vote. And to ensure that young voters didn’t comprise a disproportionately high share of the electorate, we weighted them to the appropriate electorate share for the final results.
So, what did this national poll say about 2024? Among all voters, Donald Trump leads the field with 39% to Biden’s 37% of the vote. Robert F. Kennedy, Jr. comes in at a distant third, with 11% of the vote. Around 10% of Americans are still undecided, and a further 3% say they would not vote if these candidates are the only ones on the ballot.

When the undecided voters are pushed, the candidate shares rise to 41% for Trump, 40% for Biden, and 16% for RFK Jr. Interestingly, this Trump lead comes despite Democrats actually leading Republicans on the generic ballot, 44% to 42% (though neither are statistically significant leads).

The topline itself probably doesn’t come as a big surprise — this result is broadly in line with the vast majority of recent polls. A more interesting result, however, is found in the youth vote, because the national, opt-in panel-based survey yielded drastically different results from the live texting poll for voters under 30.
As a reminder, our live texting survey suggested minimal gains for Donald Trump among young voters in both favorability and vote share. While president Joe Biden remained deeply unpopular with this demographic, the support that he lost went to RFK Jr. or to abstentions, rather than to Trump. This is why Biden led Trump among young voters in our previous survey, 35% to 25%.
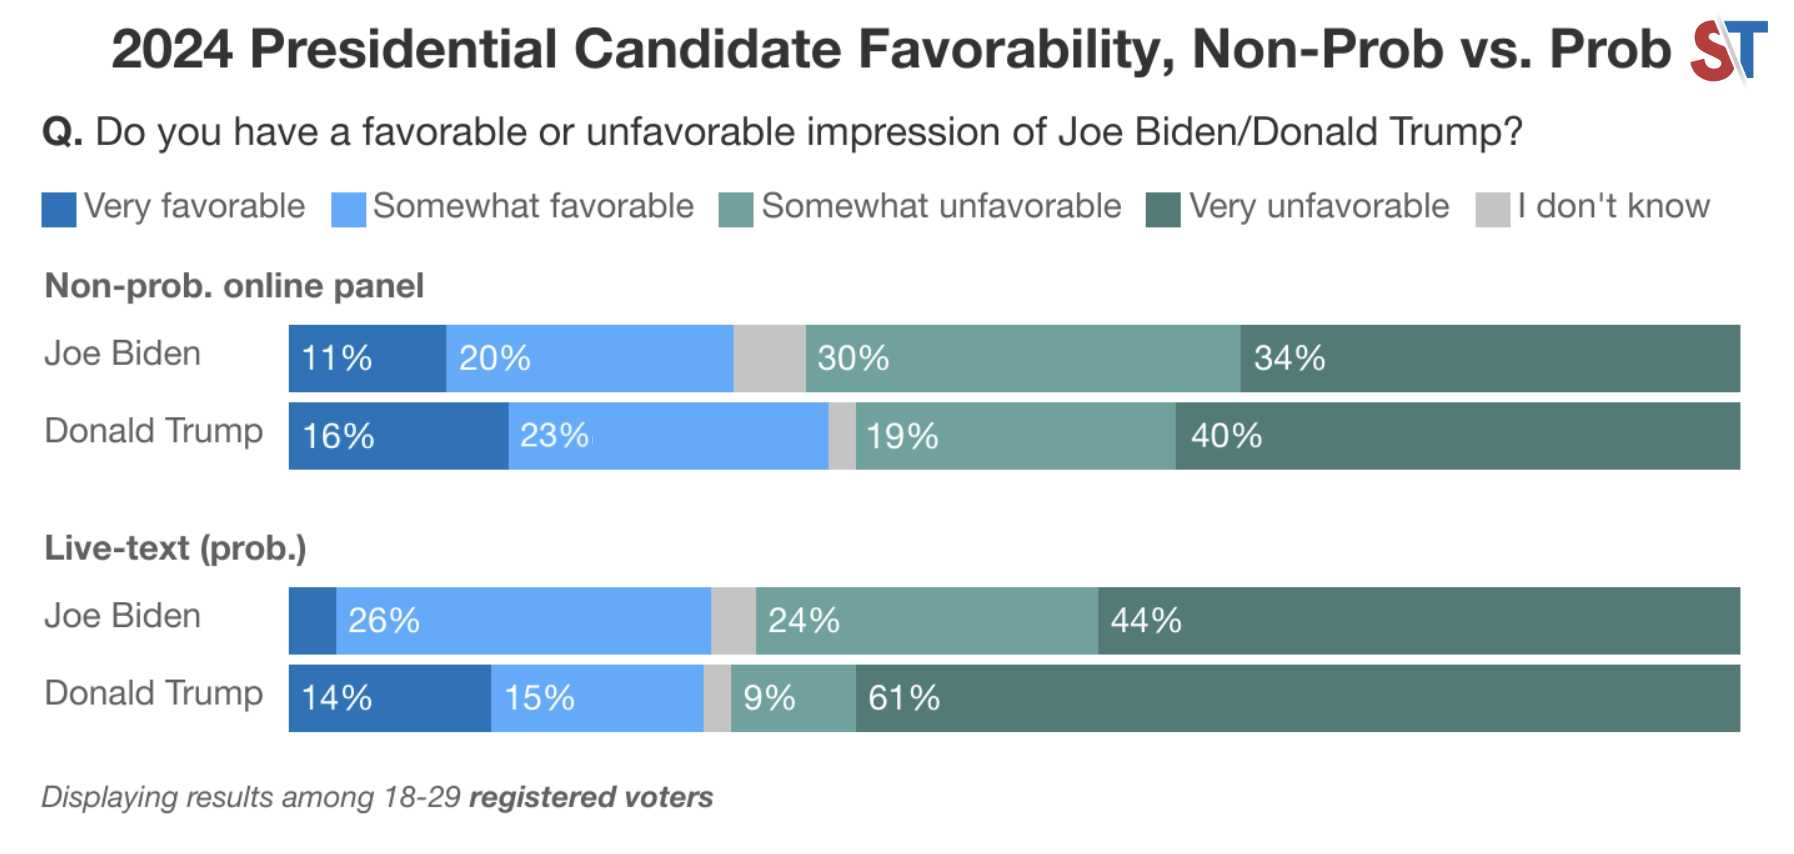
Importantly, while those voters broadly disliked Biden in our text-based survey, their antipathy towards him was much lower than it was towards Trump, whom a full 61% of young voters viewed “very unfavorably”. This explained why Trump’s vote share remained so low despite Biden’s incredibly poor approvals — young voters strongly disliked the former more than they did the latter. It also explained the surprisingly high vote share for RFK Jr. (23%), as a large chunk of disaffected voters seemed to view him as an outlet for a “protest vote”.
The online panel, however, was entirely different. In this survey, Donald Trump narrowly won young voters outright, getting 34% of the vote. In doing so, he eclipses Joe Biden’s 32% share and RFK Jr.’s 18%.
Pushing undecided voters doesn’t change these numbers much. When undecideds are pushed, Trump gets 37% among young voters, compared to Biden’s 36% and RFK Jr.’s 24%. In this survey, Trump gets a considerably higher share of the vote overall, and the young respondents seem significantly more “Trump-curious” — his favorability with young voters registers at a relatively high 39%, which is virtually identical to his overall favorability of 40% in our survey.

Essentially, the opt-in panel methodology appears to yield very different results from the oversample live-texting poll, and it is mostly centered around differences in young voter opinions of Donald Trump (though it may be worth pointing out that even Biden’s “strongly favorable” rating is significantly higher in the panel, at 11%, than it is in the text-based survey, where it sits at an abysmal 3%).
It’s also important to highlight that these young voters aren’t actually oddly Republican, all things considered. The sample appears to be pretty normal with respect to partisanship — Democrats win the generic ballot 49–34 among voters under 30, which is a very similar two-way margin to the results in 2020 and 2022. That means the sample isn’t necessarily skewed from being overly Republican. It’s just that the voters here seem to really dislike Joe Biden in particular, and oddly enough, seem to view Trump far more favorably than our text-based respondents do.

There could be a few reasons for this. Perhaps the shift is entirely legitimate in the panel, and it is the text-based survey that is off. If so, the explanation would probably be simple. Biden is an extremely old president, and his handling of the economy and the Israel/Hamas conflict consistently receives low marks, especially from young voters. It is possible that some young voters are simply just angry with Biden and view Trump increasingly favorably in retrospect, even while intending to vote for Democrats down the ballot.
But if it sounds like I’m struggling to believe the paragraph I just wrote above, it’s because I am. There are several flags that make me wonder what’s going on. For instance, the incredibly high levels of ticket-splitting are quite surprising. Congressional Democrats outrunning Biden by 17 points nationally with any large demographic would be virtually unheard of in the modern era. A split of that magnitude among a national sample raises more questions than it answers, and I’m afraid nobody has too many satisfactory answers yet — only hypotheses.
It could be that this is largely due to “expressive responding”, where voters who are especially motivated to respond to surveys are disproportionately making their voices heard (however, that typically doesn’t account for such a large gap). Opt-in panels often yield samples that are disproportionately high-engagement, and thus, these types of voters are more likely to surface there.
Given that a generic Democrat still leads by a healthy margin with these voters, logic suggests that most of the ones that do vote in November are likely to return to Biden’s fold, despite being very upset at and unwilling to express support for him at the moment. But while that might explain the gap between Biden and a generic Democrat, it doesn’t explain Trump’s abnormally high favorables with young voters in this survey, especially relative to the nation.
The second factor to consider is that online, opt-in panels are notoriously bad at surveying young voters and struggle with obtaining representative samples, as shown by a recent Pew Research Center study. This means that the sample composition for the second survey is likely completely different in composition, at a level that goes deeper than the demographics we could control for. While I’m not sure that these two factors account for the entirety of the gap between the text and the panel surveys, I do suspect that it is part of the reason.
Crucially, these subsamples were both internally weighted to be representative of young voters (which we refer to as “nesting” our weights). This is different from most crosstabs you see in public polling, which are not weighted internally. In general, the crosstabs of voters from a particular demographic are not weighted to be individually representative of that subgroup. For example, a little over 50% of young registered voters are female, and we weighted our sample to reflect this; however, in many public crosstabs, there is no such guarantee, and so you could end up with a weighted youth sample that is 60% male.
This is usually by design, as pollsters often simply do not have enough data to separately weight their subsamples. However, this also leads to significantly riskier analysis, especially when it comes to subgroups — for example, a subgroup that is 65% male is going to be more Republican than one that is 48% male. We’ve seen that while internal crosstab weighting usually does not change the topline results much, it does change the crosstabs a lot.
For an example of this, consider the results we’d have presented to you if we didn’t weight our oversample in a representative manner (denoted by the term “non-prob. non-nested” in the graphic below). Though the topline results among all voters would have changed by less than half a percentage point, the crosstabs would have been dramatically different — Donald Trump would have won young voters 38%–26%.

Just as surprisingly, if we hadn’t weighted the youth demographic separately in our poll, young voters would have only gone for congressional Democrats by 3% (as opposed to the 15% they backed a generic Democrat by in our weighted oversample). These are fairly different findings.

Lastly, if we hadn’t “nested” our weights for the youth demographic, Donald Trump’s favorability with voters under 30 would have been even higher, at 41 favorable–54 unfavorable. That is a far cry from the 29 favorable–70 unfavorable rating that we found for him in our live text survey.

In essence, not weighting this subsample seemed to drive up the “Trumpiness” of the young voter demographic, because the Trump-curious young voters are upweighted in the process of making the sample representative at a national level (rather than at a subgroup level).
I’d wager that this is one of the big reasons that pollsters like SurveyUSA get crosstabs that show Trump winning young voters by 29 points in Minnesota. And while Fox News uses a probability-based methodology, the differences we’re seeing by survey type are a signal that some results (like their crosstab showing young voters breaking overwhelmingly for Trump) have more to do with sample composition than anything else.
The results of this exercise give me even more pause in taking crosstabs from most pollsters at face value. If you’re not careful about how your weights are impacting subgroup numbers, you can end up with wildly unstable “phantom swings” from poll to poll that are really just a function of how individual respondents get weighted.
I don’t discount the toplines presented by most of these pollsters — again, internally weighting voters aged 18-29 barely shifted our topline. Usually, there are enough cross-cutting errors in how voters are weighted to not change the final topline estimates too much. But the topline is often the least useful part of any serious, carefully-crafted poll, and for actual crosstab analysis, it’s worth being a bit more judicious with interpretations.
In other words, be very wary of treating crosstabs as “mini polls”. Unless they’ve been designed for the samples to be representative at a subgroup level, this is often a big mistake.
Acknowledgements: The survey was designed by Lakshya Jain, Giacomo Squatriti, Hannah Ritz, and Graham Andrews, and was weighted by Lakshya Jain and Giacomo Squatriti. Graphics were created by Hannah Ritz, Graham Andrews, and Andres Alvarez. The full crosstabs may be found here.
Note: On April 16, 2024, the article received a minor graphics correction for one image, concerning Donald Trump’s favorability with voters under 30 in the non-probability panel.
I’m a software engineer and a computer scientist (UC Berkeley class of 2019 BA, class of 2020 MS) who has an interest in machine learning, politics, and electoral data. I’m a partner at Split Ticket, handle our Senate races, and make many kinds of electoral models.