If you looked at the landslide Democratic victory in the state Supreme Court election in Wisconsin, you might think that public opinion had swung sharply and massively against Donald Trump and the GOP, despite Elon Musk’s eight-figure investment in the state. But while persuasion certainly explains part of the victory, the full story is not so simple.
Our pre-election modeling and preview pointed to an obvious turnout advantage that Democrats enjoyed, flagging it as a sign they could win big on April 1st. This is because the higher-propensity voters who vote in off-cycle elections tend to lean left of the low-propensity voters who only show up in presidential years. The election results validate that theory, showing how an overwhelmingly blue electorate left Wisconsin Republicans in the dust.
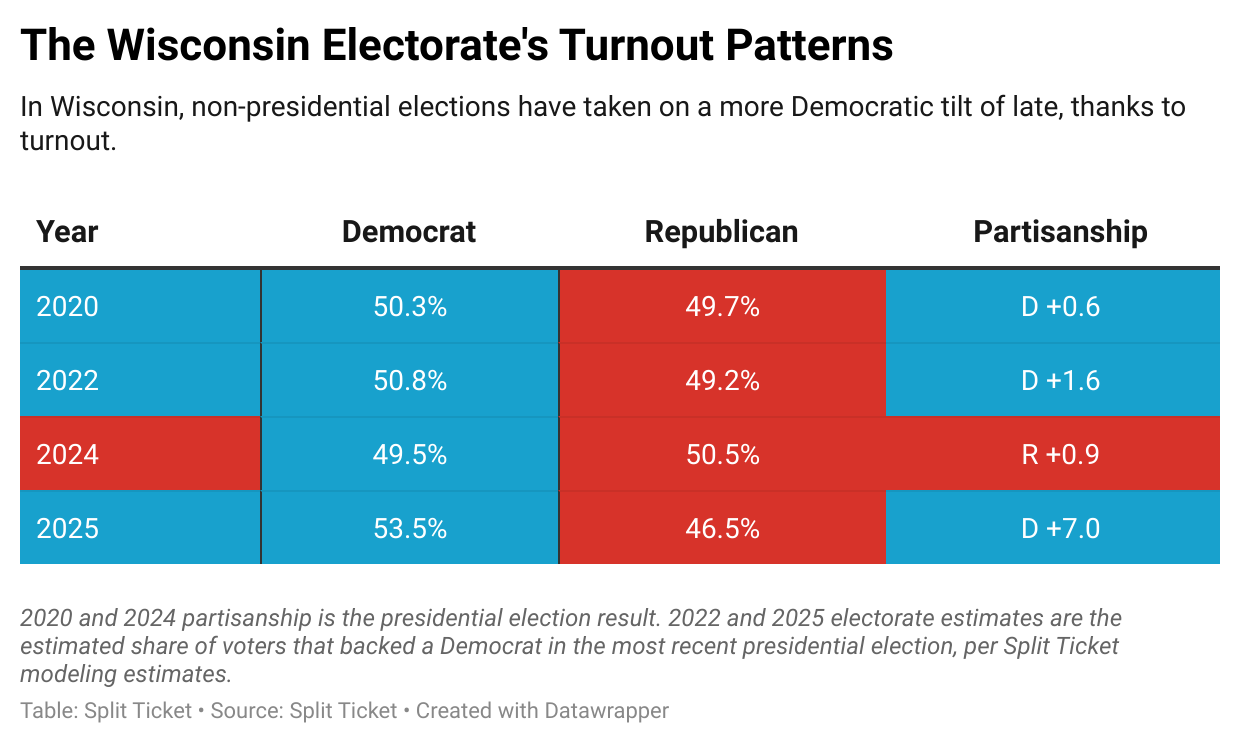
Our estimate is that the voters who voted in the 2025 Supreme Court election backed Kamala Harris by 7 points in 2024. In other words, roughly 70% of Susan Crawford’s win margin was attributable to changes in who was voting, rather than changes in how people voted. While the persuasion she got would still have been enough to flip the state with a November 2024 electorate (which was Trump +1), the landslide victory largely came down to a big turnout advantage.
Intuitively, this makes a lot of sense — the voters who show up in off-cycle elections tend to be far more educated and engaged, which also means they’re more partisan and thus significantly less prone to persuasion. This generally gives Democrats an inherent coalition boost in special elections, because their voters (especially in whiter areas) are more educated and thus more likely to turn out. On top of that, the party also enjoys an intra-demographic advantage, as high-engagement Democrats turn out at higher rates than high-engagement Republicans do in every demographic category, per The New York Times.
The net result was a massive edge for Democrats, even in a race that had record-setting turnout for an April election. All across Wisconsin, whether in big cities or the tiniest rural villages, Democrats mostly did a much better job of showing up than Republicans did.

The largest turnout differentials are found in western Wisconsin, which is full of low-propensity voters who were Democrats before Trump came around. While the impact of this realignment is plainly visible in presidential years, it is not nearly as obvious in other elections, where these voters mostly don’t show up. In fact, when the swings are broken down by geography, we can see that while the Driftless Area got 16 points bluer, almost all of that was because of a change in who was voting, rather than Trump voters crossing over to vote for Susan Crawford.

The geographic differences confirm preexisting patterns of educated white voters punching above their weight for Democrats, and the impact of the low-propensity voter realignment is especially visible in the western part of the state. Looking forward to 2026, this coalition that Wisconsin Democrats have arranged could prove crucial to flipping the state legislature and holding their existing statewide offices.
For example, Derrick Van Orden’s WI-03 is high on Democratic target lists. Much of the Republican base in this seat does not vote when Donald Trump is not on the ballot — though it was R +8 in 2024, our estimates suggest that Kamala Harris comfortably won the electorate that actually showed up in April 2025. A bluer electorate relative to 2024 would put him in the electoral crosshairs, especially considering he only won by 2% against Rebecca Cooke, who is gunning for a rematch against him.
These turnout dynamics in Wisconsin invert previous Democratic political thought. Previously, low-propensity working class voters of all races showing up in presidential years used to benefit Democrats. In midterms, those voters would stay home, usually giving Republicans an advantage. But this has not been the case of late — in 2022, 2023, and 2025, the voters that showed up were much more Democratic than the partisanship of the state.
The results of the April elections also vindicate Split Ticket’s own early vote modeling. The data showed a clear liberal edge in turnout that no amount of campaigning from Elon Musk could have realistically erased. Of course, the difference between the Supreme Court and Superintendent races show that voter behavior isn’t solely dependent on turnout. (In fact, it is probably worth noting that Jill Underly, who “only” won by 6%, would likely have lost re-election if she faced the 2024 electorate). But it did drive the bulk of this titanic swing.
While we certainly don’t expect an 8-point gap between the partisanships of the 2024 and 2026 electorates, we wouldn’t be surprised by a 4-5 point gap (placing 2026’s electorate at Harris +2 or +3). It’s important to remember that the 2022 electorate was probably Harris +1 by 2024 vote — considering how the realignment in engagement has only accelerated since then, and given that Democrats are now more enthusiastic to vote because they are out of power, we’d expect 2026 to be worse in turnout for the GOP.
Many of the most pro-Trump Republicans have tuned out of politics following the presidential election, while Democrats stay engaged and vote at every opportunity they have. Where that takes the electoral map in 2026 will be interesting to see — but our guess is that at the moment, it goes against the Republicans.
Methodological footnotes:
To separate swing and persuasion, we regressed the 2024-25 swing against the turnout and partisanship of each precinct, stratified by geographic region. The results of this regression allow us to predict how each precinct “should have” swung at full turnout, and comparing this to the actual swing of the precinct lets us quantify how much of the swing was due to differential turnout.
This technique was also backtested against the 2022 Wisconsin gubernatorial and senatorial election. Our technique estimated that the 2022 electorate in Wisconsin backed Joe Biden by 50.8%, which is strikingly similar to the voter file estimation done by The New York Times (which estimated 50.9%). Importantly, our modeling technique yielded nearly-identical estimates for both elections, despite the results being more than 4% apart, validating our technique and proving that it is not sensitive to the exact margin in the race.
Thank you to VoteHub for providing us with the 2024 and 2025 data for our estimates.
I’m a computer scientist who has an interest in machine learning, politics, and electoral data. I’m a cofounder and partner at Split Ticket and make many kinds of election models. I graduated from UC Berkeley and work as a software & AI engineer. You can contact me at lakshya@splitticket.org
I’m a political analyst here at Split Ticket, where I handle the coverage of our Senate races. I graduated from Yale in 2021 with a degree in Statistics and Data Science. I’m interested in finance, education, and electoral data – and make plenty of models and maps in my free time.