The Senate’s rural bias has put Democrats at a severe disadvantage in the chamber. This has been compounded by the rise of polarization, which cost Democrats the red states of Montana, West Virginia, and Ohio in 2024 — and what’s worse, there currently doesn’t seem to be a plausible path back to consistently winning states that Trump just won by double digits.
To appeal to persuadable voters in these states, Democratic strategists have supported running “strategic independents,” or candidates backed by the Democratic Party who aren’t formally affiliated with it, in an effort to break free of a Democratic brand that has rapidly turned toxic in many areas. While none of the candidates they have tried this strategy with have won so far, all of them overperformed expectations.
Since 2014, Democrats have run four major Senate campaigns with independent candidates: Kansas in 2014, Alaska in 2020, Utah in 2022, and Nebraska in 2024. In Kansas, Greg Orman outperformed Obama’s 2012 margin by 11 points. In Alaska, Al Gross did 2 points above replacement, per our Split Ticket Wins-Above-Replacement (WAR) scores. And in Utah and Nebraska, McMullin and Osborn both had a WAR of +18, making them two of the strongest challengers in the modern era.
All four of these states have a few characteristics in common. First, they are very white. Second, apart from Alaska, they are all located in either the Plains or Mountain West regions. Third, they are some of the few rural, Republican states that are highly religious but have a small Evangelical presence. The smaller Evangelical influence leaves more breathing room for strategic independent candidates to moderate.
The precinct results show a big difference between majority/plurality-white precincts and majority/plurality non-white precincts.

In our four case studies, majority-nonwhite precincts shifted more to the GOP than majority-white precincts. In Kansas, for instance, majority-nonwhite precincts shifted almost 20 points further to the right than majority-white precincts. In Alaska and Utah, this pattern wasn’t as clear, but still played a role. Finally, in Nebraska, Osborn improved across the board, but his improvement was stronger in majority-white precincts.
The data shows that while these independent candidates overperformed statewide, they struggled to hit Democratic margins with minority voters. The Democratic label is a stronger motivator for minority voters in terms of turnout and persuasion.
A perfect example of this is found in Arkansas’s 2020 Senate election, where we see what happens when no Democratic candidate runs in a state with a significant minority population. Republican incumbent Tom Cotton easily defeated Libertarian Ricky Dale Harrington, winning several black-majority counties.
While Harrington was not a Democrat, his candidacy was a good proxy for the anti-GOP vote in Arkansas. In the majority-white precincts of the state, Trump won the presidential race by 39 points, and Cotton won them by 43 — a 4-point underperformance. Looking at the plurality-minority precincts, Biden won them by 29, while Harrington only won them by 17 — a 12-point underperformance. That delta in voting behavior suggests that an actual Democratic candidate would have done better against Cotton.
All of this is to say that Democrats can’t simply flip red states with a “one-or-the-other” approach. There is a real trade-off that occurs, where the strategies that appeal to white voters don’t necessarily hold the same weight with non-white voters, and so the more non-white the state is, the tougher the task of an Independent becomes. To demonstrate, we created a metric that assesses which red states would be most favorable to an independent campaign, measuring a state’s partisanship, racial demographics and Evangelical presence.
Racial polarization often causes partisan affiliation to be associated with identity. A conservative-coded independent’s main appeal to middle-of-the-road voters is distance from the Democratic Party, but this can hurt them among Democratic voters who are attached to the party brand. This effect is clearest in the remaining Black-majority parts of the South.
We estimate racial-geographic diffusion of the Democratic vote by calculating the percentage of Democratic votes coming from majority-minority precincts. This is important because political and geographic segregation have made it harder for independent campaigns to form winning coalitions. The map below shows the percentage of Democrats living in majority-minority precincts, with the highest “estimated share of Democrats who are nonwhite” being in the South, where nonwhite voters are known to make up the bulk of the Democratic Party’s voter base.

Another factor is a large Evangelical presence, which serves as a bulwark for social conservatism. Thus, the Democratic Party’s success through running an independent is inversely correlated with the prevalence of Evangelicals, who are the least likely to split their tickets. The below map shows the Evangelical population by state, with the highest concentrations also found in the South.

To complete the metric, we add these numbers to the two-party Republican margin of victory by state in the 2024 election — and for reference, we’ve placed that right here.

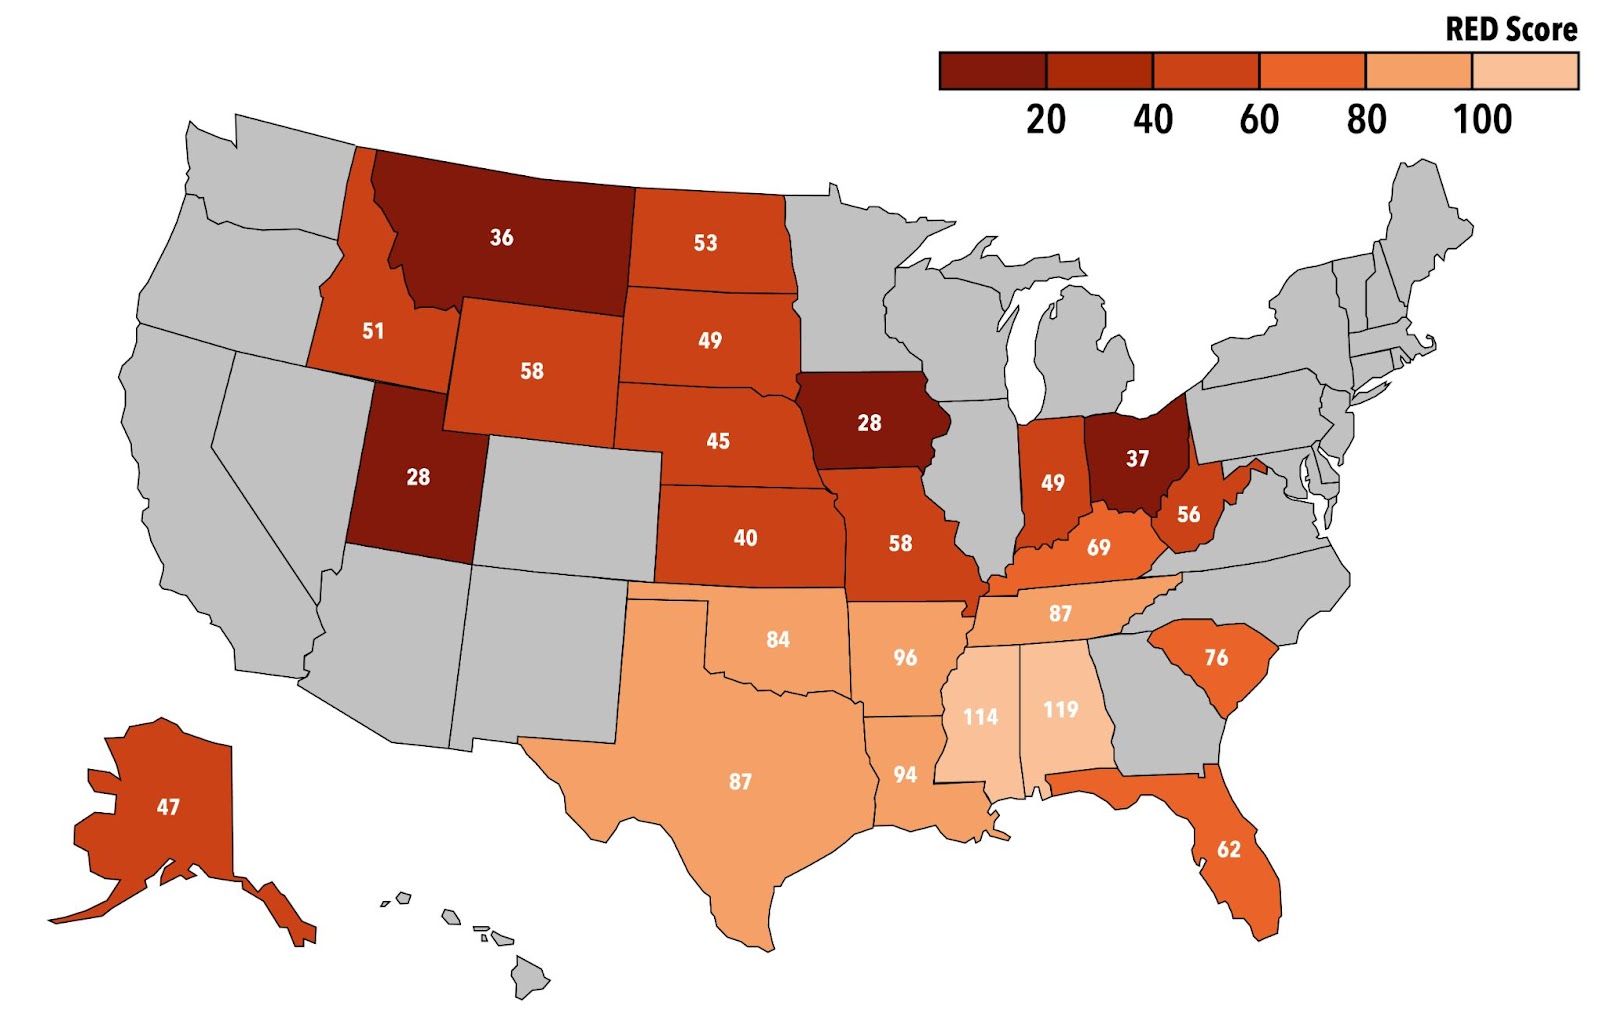
The sum of these numbers is called the RED score (Republican, Evangelical, and Diffusion of Democratic Voters). Lower RED scores mean that the state is more flexible and open to a strategic independent campaign.

Low RED scores help us understand why independents in Utah, Kansas, Nebraska, and Alaska did well. By contrast, high RED scores confirm that much of the Deep South is off-limits to this kind of candidate. States like Texas and Florida aren’t any redder than Iowa, for example, but high racial-geographic diffusion makes the task for a non-Republican herculean.
Looking to 2026, Iowa stands out. With a low Evangelical population, and with low racial polarization, a conservative-coded independent could make serious headway here. Iowa shares similarity with the Midwestern states where Kamala Harris held up best in 2024, and it isn’t far off from Nebraska, where Osborn’s independent campaign did better-than-expected. Add to this the fact that Republican Joni Ernst is a WAR underperformer, and you could see a truly competitive race, especially with midterm backlash.
The other states to look at are Montana, Ohio, Kansas, Nebraska, and Alaska. Ohio’s open seat as well as those with relatively middling Republican incumbents (Roger Marshall in Kansas, Dan Sullivan in Alaska), are all plausible targets for a strategic independent campaign.
Not mentioned in this list but worth discussing is Maine, where Republican Susan Collins has beaten back five Democratic challenges over the past three decades. Given Maine’s small minority and Evangelical presence, the state would be fertile ground for an independent challenge to Collins. Maine’s other Senator, Angus King, was also elected governor and senator as an independent.
One cautionary note: there is no way to know intra-precinct differences between minority voter groups. However, the fact that our analysis deals with states that have at least 600 precincts each greatly reduces the likelihood of error. RED scores also don’t predict the success of specific independent campaigns, only a state’s suitability for one. For example, Al Gross’s campaign in Alaska veered too close to the national Democratic campaign, contributing to his loss. Yet, by RED score, Alaska remains fertile ground for a strong independent campaign.
FOOTNOTES:
Here follows the justification for choosing racial-geographical diffusion of the Democratic vote, as well as evangelical percentage as the two main variables in determining RED scores:
Political and geographical segregation of the races over time has led to disparate political communities that a cross-party independent campaign would struggle to bind together into a winning coalition. The whitest states naturally have the fewest minority enclaves, while the highest occurrences are found in the Deep South, where sizable Black populations make up the bulk of the Democratic Party’s voter base against a cohesive Republican white voting bloc.
Self-indentified evangelical Christians are typically much more likely to believe in the inerrancy of the Bible, which typically leads to a more conservative understanding of morality and social order. Additionally, congregations tend to be smaller and more politically involved than their non-evangelical counterparts. Taken together, this means evangelical Christians are a much more “loyal” voting bloc than other Christians, who may normally vote Republican but are much more open to defection for an independent.
When these two are together, they serve as a barometer for the pervading pro-status quo bias in favor of the current racial/religious order that defines the political axes of conflict. A lower metric of racial and religious conservatism leads to higher openness to breaking with the GOP brand in red states, as there are fewer communal bonds holding the conservatism together.
These two axes serve to regularize the preexisting demographic factors and partisan leans of states. For example, Texas was merely a 14-point win for Trump, but given that nearly half the Democratic base is in separated minority enclaves, peeling off both moderate-conservative whites as well as maintaining strength with existing base voters approaches mutual exclusivity given the current Democratic capabilities in the state. When factoring in these attributes and how they play into campaigning methods, flipping a state like Texas becomes as difficult as other Bible Belt stalwarts like Oklahoma and Louisiana.
Evangelical numbers were sourced from Split Ticket’s internal demographic data archive. Shapefiles were compiled from Josh Metcalf, Andrew Green, as well as the data hub of Dave’s Redistricting App. Due to a lack of a 2024 shapefile in Missouri, the numbers were calculated by scaling 2020 precinct-level data to 2024 turnout — a reasonable assumption given that very little realigned in Missouri’s political geography.
I’m a political analyst here at Split Ticket, where I handle the coverage of our Senate races. I graduated from Yale in 2021 with a degree in Statistics and Data Science. I’m interested in finance, education, and electoral data – and make plenty of models and maps in my free time.
I am an analyst specializing in elections and demography, as well as a student studying political science, sociology, and data science at Vanderbilt University. I use election data to make maps and graphics. In my spare time, you can usually find me somewhere on the Chesapeake Bay. You can find me at @maxtmcc on Twitter.