In redistricting, partisan balance is a central component of debates around the fairness of a map. Those arguing that a map is an unconstitutional gerrymander often point to the partisan balance of the map not matching the state’s, while those defending it often say that the state’s geography is simply not friendly to the opposite party.
The truth is that it is not always easy to dismiss this perspective out of hand – political geography can and often does cost a party in a state, as seen with Republicans in Massachusetts getting zero House seats despite netting nearly a third of the vote. But this argument is used as an excuse for extremely imbalanced partisan gerrymanders, like the ones seen in Illinois and the proposed North Carolina maps.
There is, in fact, a way to quantify the partisan balance that ostensibly fair maps should have from the perspective of geography and partisanship. To do this, we’ll introduce a new metric, designed by Split Ticket partners Armin Thomas and Lakshya Jain, called the JTC (short for the Jain-Thomas Constant). The idea revolves around the concept of wasted votes – that is, how many of a party’s voters live in precincts dominated by the opposite party?
Why are these votes called wasted? Simply put, in redistricting, it means that in order to put these voters in a district matching their preferred partisanship, one must put more of the opposite party’s voters in the seat with them, which weakens the original group’s ability to elect a candidate of its choice.
To calculate the metric, we first calculate the ratio of Democratic voters in Democratic precincts to Democratic voters in Republican precincts. We then calculate the Republican analogue, which is the ratio of Republican voters in Republican precincts to Republican voters in Democratic precincts. We then take the difference between these ratios – a positive number indicates favorable Democratic geography, while a negative value indicates favorable Republican geography.
This formula can be easily extended to calculate the ideal number of seats for each party on a per-state basis in a world that only considers political geography, 2020 presidential results for each state, and the current interpretation of the VRA (for simplicity, we do not explicitly consider factors like existing incumbency or minimization of county splits in this article). Below, we show the expected breakdown of seats for states; the first shows the states that are overall more geographically friendly to Democrats, ranked in order from most to least friendly by the JTC, while the second image shows the states that are more geographically friendly towards Democrats, also ranked from most to least friendly.


When examined in visual form, a map of this metric bears a striking resemblance to national presidential results, illustrating the correlation between friendly redistricting geography and state partisanship.
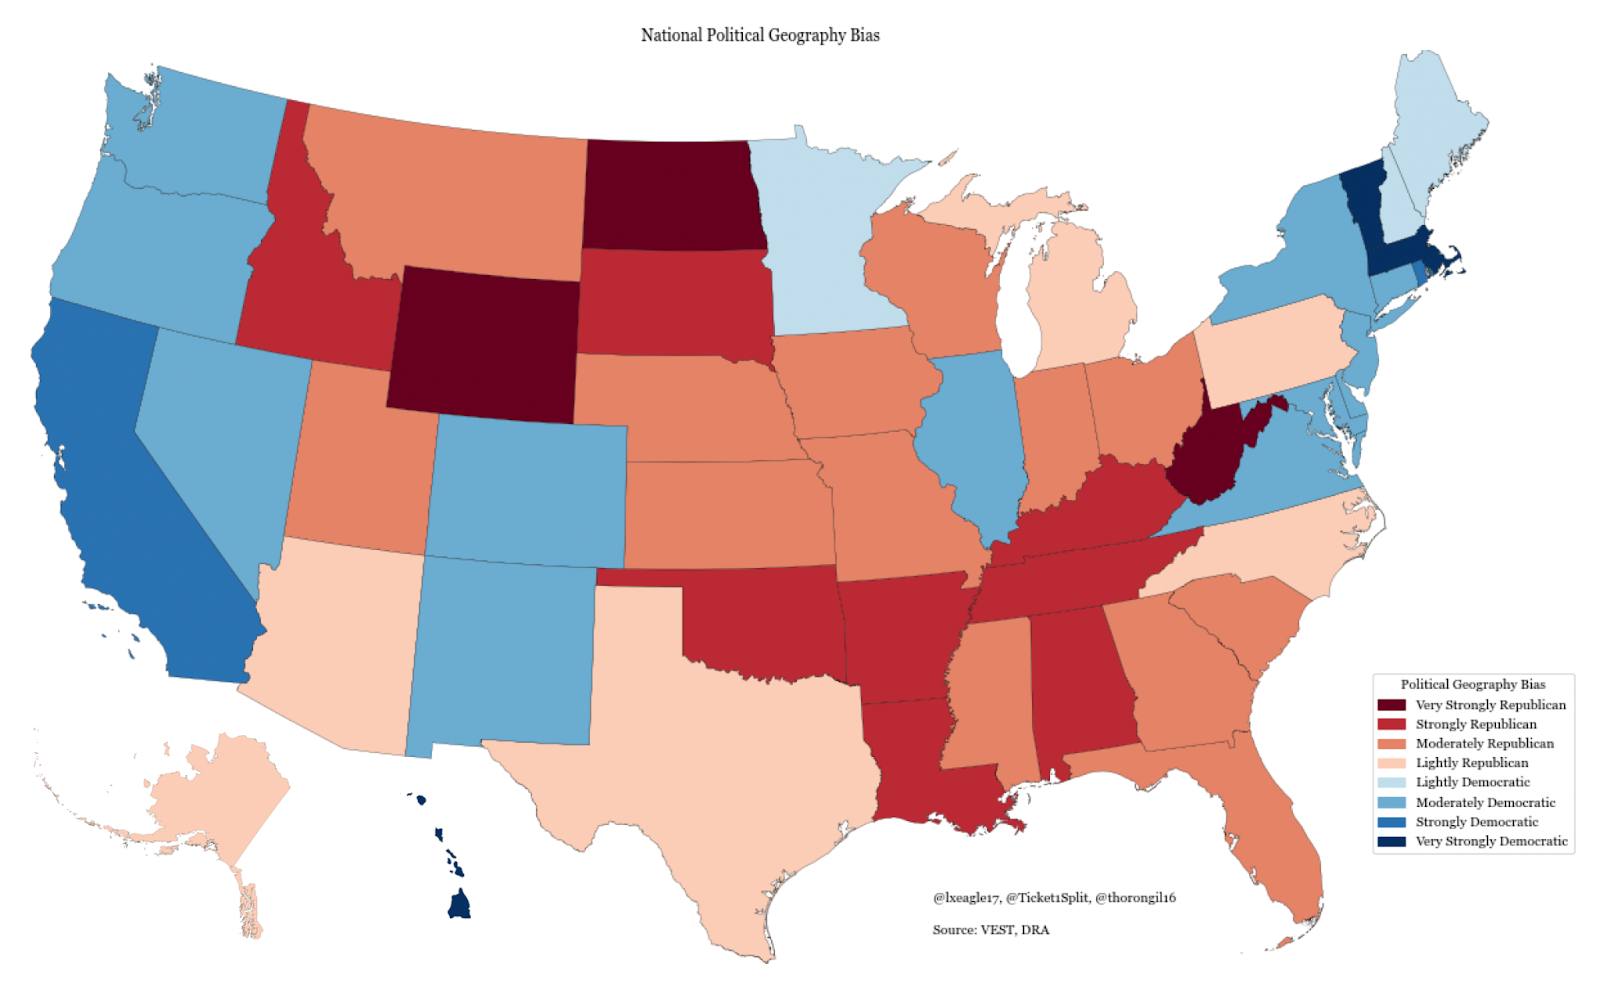
The charts further illustrate the fact that this cycle has seen several highly egregious gerrymanders from both parties. New York’s map, which is likely to split 22D-4R, gives Democrats a full five seats more than expected, while Illinois’ likely 14D-3R map gives Democrats three more seats than our calculated baseline. On the Republican side, the proposed Ohio and North Carolina maps, which were 13R-2D and 11R-3D respectively, also fall far below the ideal balance, as does the 24R-14D Texas map.
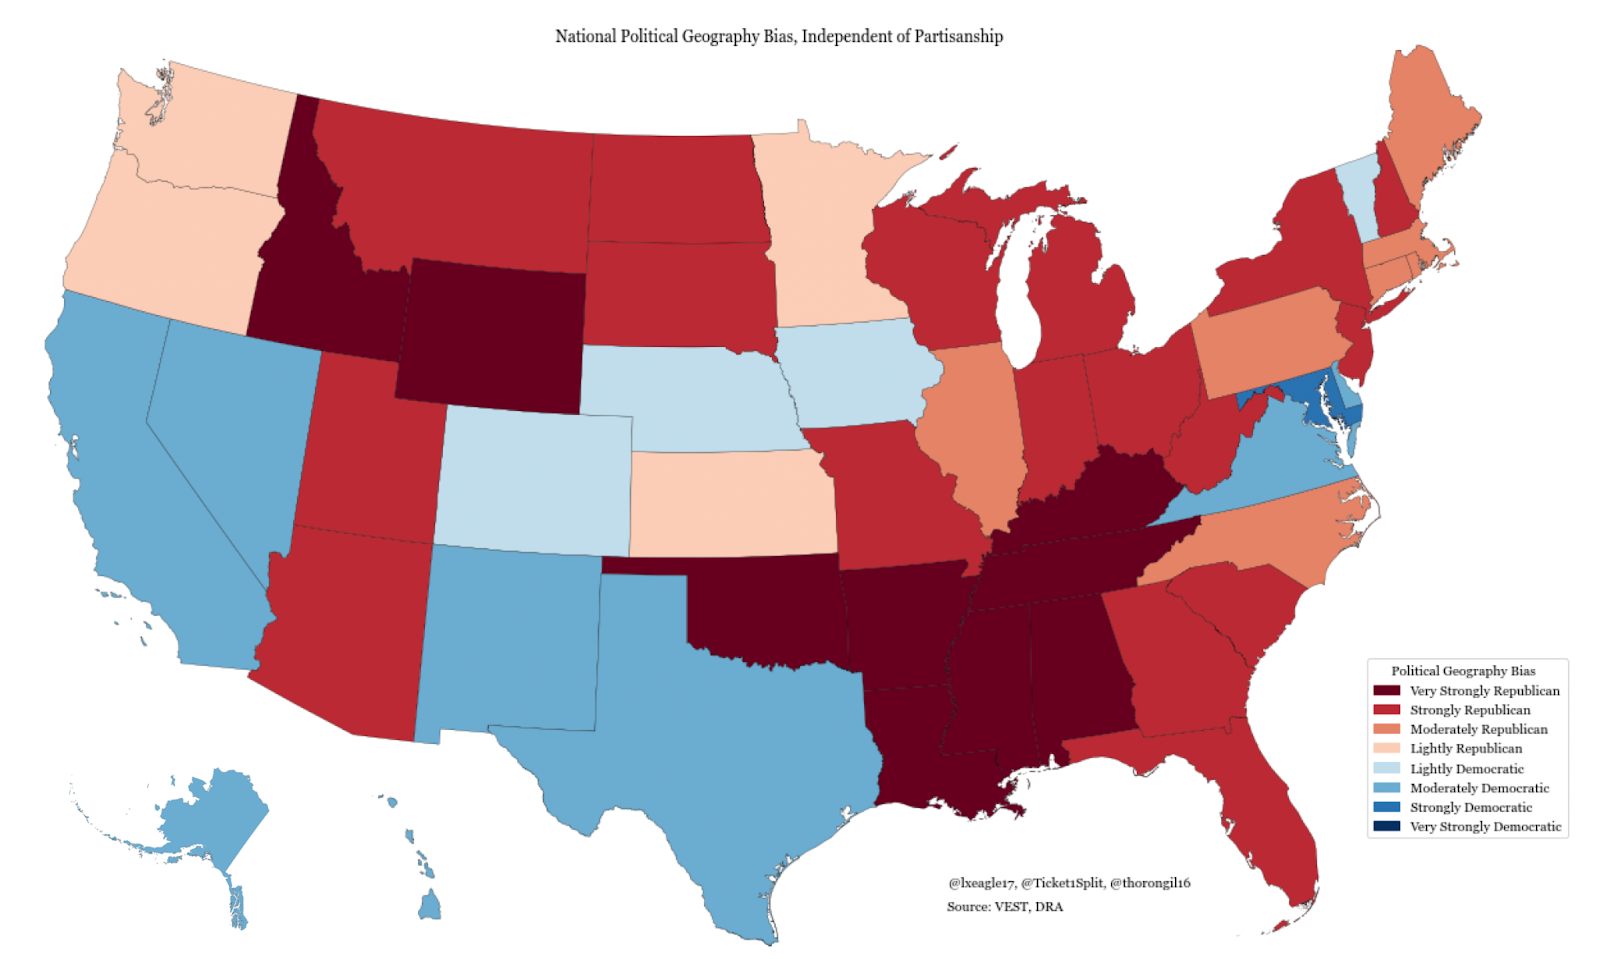
It is also interesting to examine how geography shapes up in states when controlling for partisanship – that is, in a world where each state was 50/50 with the current party coalitions, who would geography favor? The answer is that Republicans would very clearly benefit from geography in a world like this, with the GOP having a geographical advantage in 37 of the 50 states. This comes as a result of the heavily white and rural imbalance in representation among states, a dynamic which generally favors the Republican party.
Just as geography dooms Republicans in New England and other blue states, it is not kind to Democrats in much of the rest of the country, particularly in the Midwest and South. Racial polarization and the loss of a Democratic rural floor have greatly diminished the number of districts that previously enabled Democrats to have an opportunity to earn their proportional share of seats. Particularly trenchant examples of this pattern exist in southern states such as Alabama, Louisiana, and Mississippi, where the black share of the electorate is heavily eclipsed by ultra-Republican white voters.
These states all exist with large black populations (28% in Alabama, 32% in Louisiana, 38% in Mississippi) that have suffered historical discrimination and are the predominant voting base of the Democratic Party in their states. But due to the aforementioned constraints of racial polarization and atomization in far-flung localities, the JTC implies that Democrats in these states will earn fewer seats than they should. This further clarifies the need for the redistricting-related provisions of Section 2 of the Voting Rights Act in order to persist and safeguard the political voice of formerly disenfranchised minorities.
Below, a ranking of states with favorable GOP and Democratic geography when controlling for partisanship; the first image shows states with a Republican advantage, ranked by JTC value, and the second shows states with a Democratic advantage, ranked by JTC value. For states with multiple congressional seats, we also provide an expected breakdown of the number of seats won by each party in the event of the state being 50/50. For instance, in the case of Alabama being tied, you would expect Democrats to win two seats while the GOP wins five, while in the case of a tied Nebraska, you would expect Democrats to win two seats while the GOP takes one.


Viewed in visual form, the contrast is even starker.
Before the normalization done above, one would expect 216 Democratic-won and 219 Republican-won seats when assessing by presidential results – a reasonable estimate given the evenly-divided nature of the country and geographic clustering overall hurting Democrats. If all of the states were somehow normalized to be 50/50, however, we would expect only 195 seats to be Democratic. This may seem extremely low, but it is largely due to the fact that the nature of the Democratic coalition is simply not friendly to their allocations in either the House or the Senate.
As a case study, let’s look at Massachusetts. It is a truism among redistricting experts that it is impossible to fairly draw a Republican-won seat in Massachusetts, especially using 2020 numbers. It is indeed possible to draw a seat that Donald Trump won by 300 votes, but due to ticket-splitting and a differential in the overall competence of the state Democratic and Republican parties, such a seat would be borderline safe for Democrats.
This edge in political geography is in part because of the persistence of the Democratic brand in more exurban, small-town, and rural parts of the state, but also simply because the partisan baseline is so pro-Democratic. If you normalize the state for its partisan lean, Democrats’ geography evaporates overnight – one can see that most of the core Democratic strength is derived from dark-blue urbanity in Boston, Cambridge, and outer Gateway Cities.

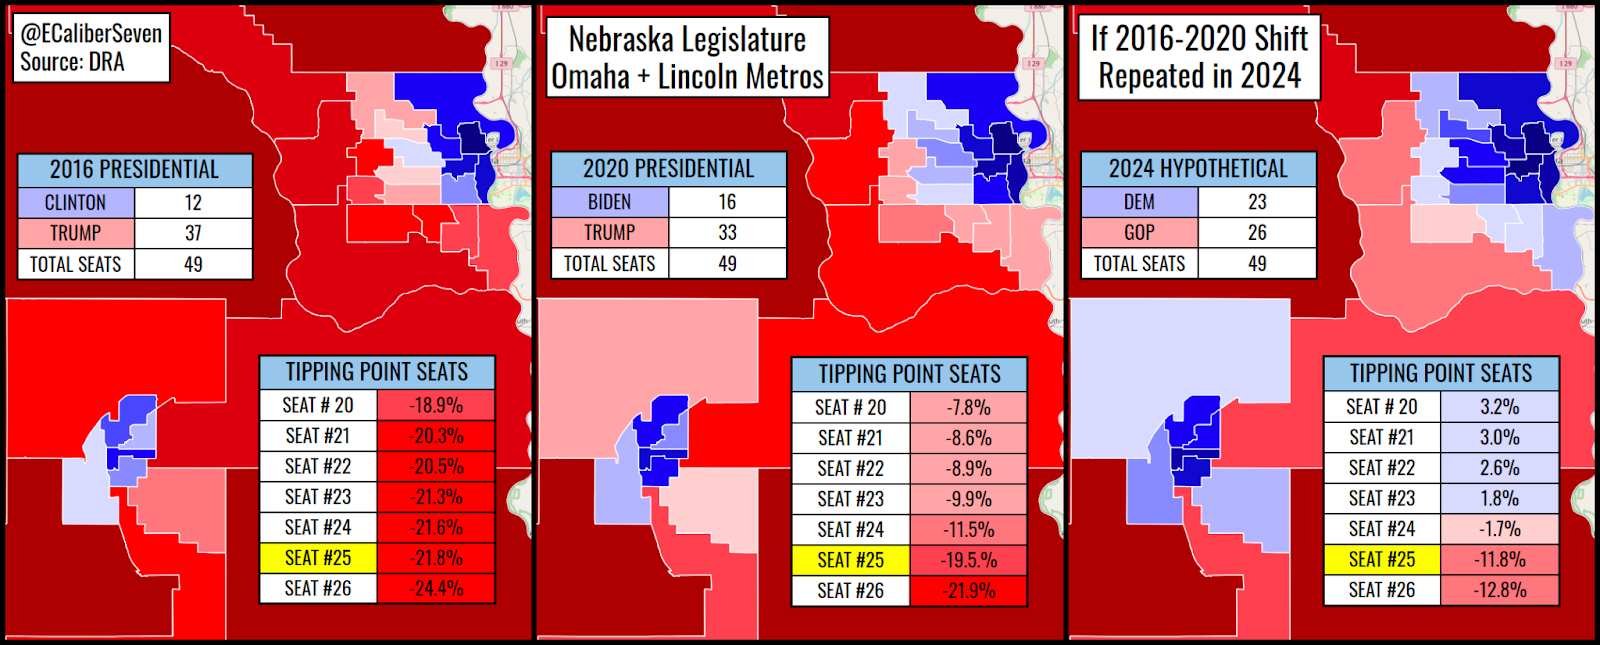
Another case study where a tied statewide vote would have differing partisan implications for geography is Nebraska. Here, instead of Democrats overpacking their votes in urban areas, it is the Republicans who instead face the challenge of unfriendly geography thanks to the deep-red rural areas, which regularly give Republicans upwards of 80 or 90 percent of the vote. That leaves the Republican voting population in urban centers, centered on Omaha and Lincoln, prone to being washed under the bluing trends of those metros. Ethan Chen has done some great work on this – showing that if the 2016-2020 swings were repeated, a viable path for Nebraska Democrats to capture a “majority” in the Unicameral Legislature does indeed exist.
Finally, the most familiar case study in this regard is the 2017 Alabama special election. Democratic attorney Doug Jones won an upset over Republican Roy Moore, outperforming Hillary Clinton’s baseline by nearly 30 points. The map from J. Miles Coleman of the Crystal Ball shows how Jones only won one out of the state’s seven congressional districts even as he narrowly won statewide, thanks to the packing of Black voters in one district. However, even a congressional map more closely resembling the Democratic-drawn lines of the 2000s-era would have seen Jones win only three out of seven seats. Thus, even in the scenario of a Democratic victory, Republicans would still be expected to win the majority of seats.

It is important to remember, of course, that political geography is not the only consideration in drawing maps, and that protections for minorities, communities of interest, and proportionality can and should be enshrined in redistricting law to ensure that voters can pick their representatives rather than the other way around. Moreover, while the JTC is, in our view, a very useful baseline metric, it can still be improved; for example, while we hope to explicitly account for geospatial clustering in future iterations, we currently do not do so. The metric must thus be couched with proper context when utilizing it to assess map fairness.
However, the metric is a good and simple way to quantify the bias of political geography in a state, and it is especially revealing regarding the partisan balance of maps in terms of redistricting. The congressional maps in several states deviate strongly from the splits suggested by the JTC, and this shows how neither party is blameless in the egregiously partisan maps that have been enacted this cycle, whether in Tennessee, Texas, or New York. But with the GOP uniformly opposed to the anti-gerrymandering legislation proposed by Democratic lawmakers, a remedy to this still appears to be only a distant speck on the horizon.
Ed. Note: A special thanks to Zach Adams for his help with this piece.
I’m a computer scientist who has an interest in machine learning, politics, and electoral data. I’m a cofounder and partner at Split Ticket and make many kinds of election models. I graduated from UC Berkeley and work as a software & AI engineer. You can contact me at lakshya@splitticket.org
I’m a political analyst here at Split Ticket, where I handle the coverage of our Senate races. I graduated from Yale in 2021 with a degree in Statistics and Data Science. I’m interested in finance, education, and electoral data – and make plenty of models and maps in my free time.