Category: Modeling
-
Introducing Split Ticket’s Congressional Voting Index (CVI)

INTRODUCTION Split Ticket’s new Congressional Voting Index (CVI) gauges each House district’s partisan lean. In contrast to counterparts like Cook PVI, our CVI uses a unique methodology that makes it more representative of the current electoral climate. This tool will improve our 2024 House ratings by shedding light on how… Read More
-
Our 2022 House Wins Above Replacement (WAR) Model

Editor’s Note: In December 2024, the Split Ticket WAR model received a major methodological upgrade that resulted in WAR score changes. The findings remain directionally the same, but the updated WAR scores are found here. Our 2020 House wins-above-replacement (WAR) model showed that spending still matters in American politics. Among… Read More
-
Election Denial Is Really Unpopular

The 2020 election was unique for a variety of reasons. Chief among them, however, was the false contention from the (losing) Republican camp that they had actually won. In the wake of the election, former president Donald Trump propagated a wave of lies regarding the results and refused to back… Read More
-
The True Swing from 2020 to 2022

Introduction Understanding the extent to which the national environment changes from election to election is a critical component of post-election analysis. While changes between presidential elections can easily be understood and quantified because of the nearly-uniform election systems in each of the 50 states, the swing from a presidential election… Read More
-
Estimating 2022’s Generic Ballot
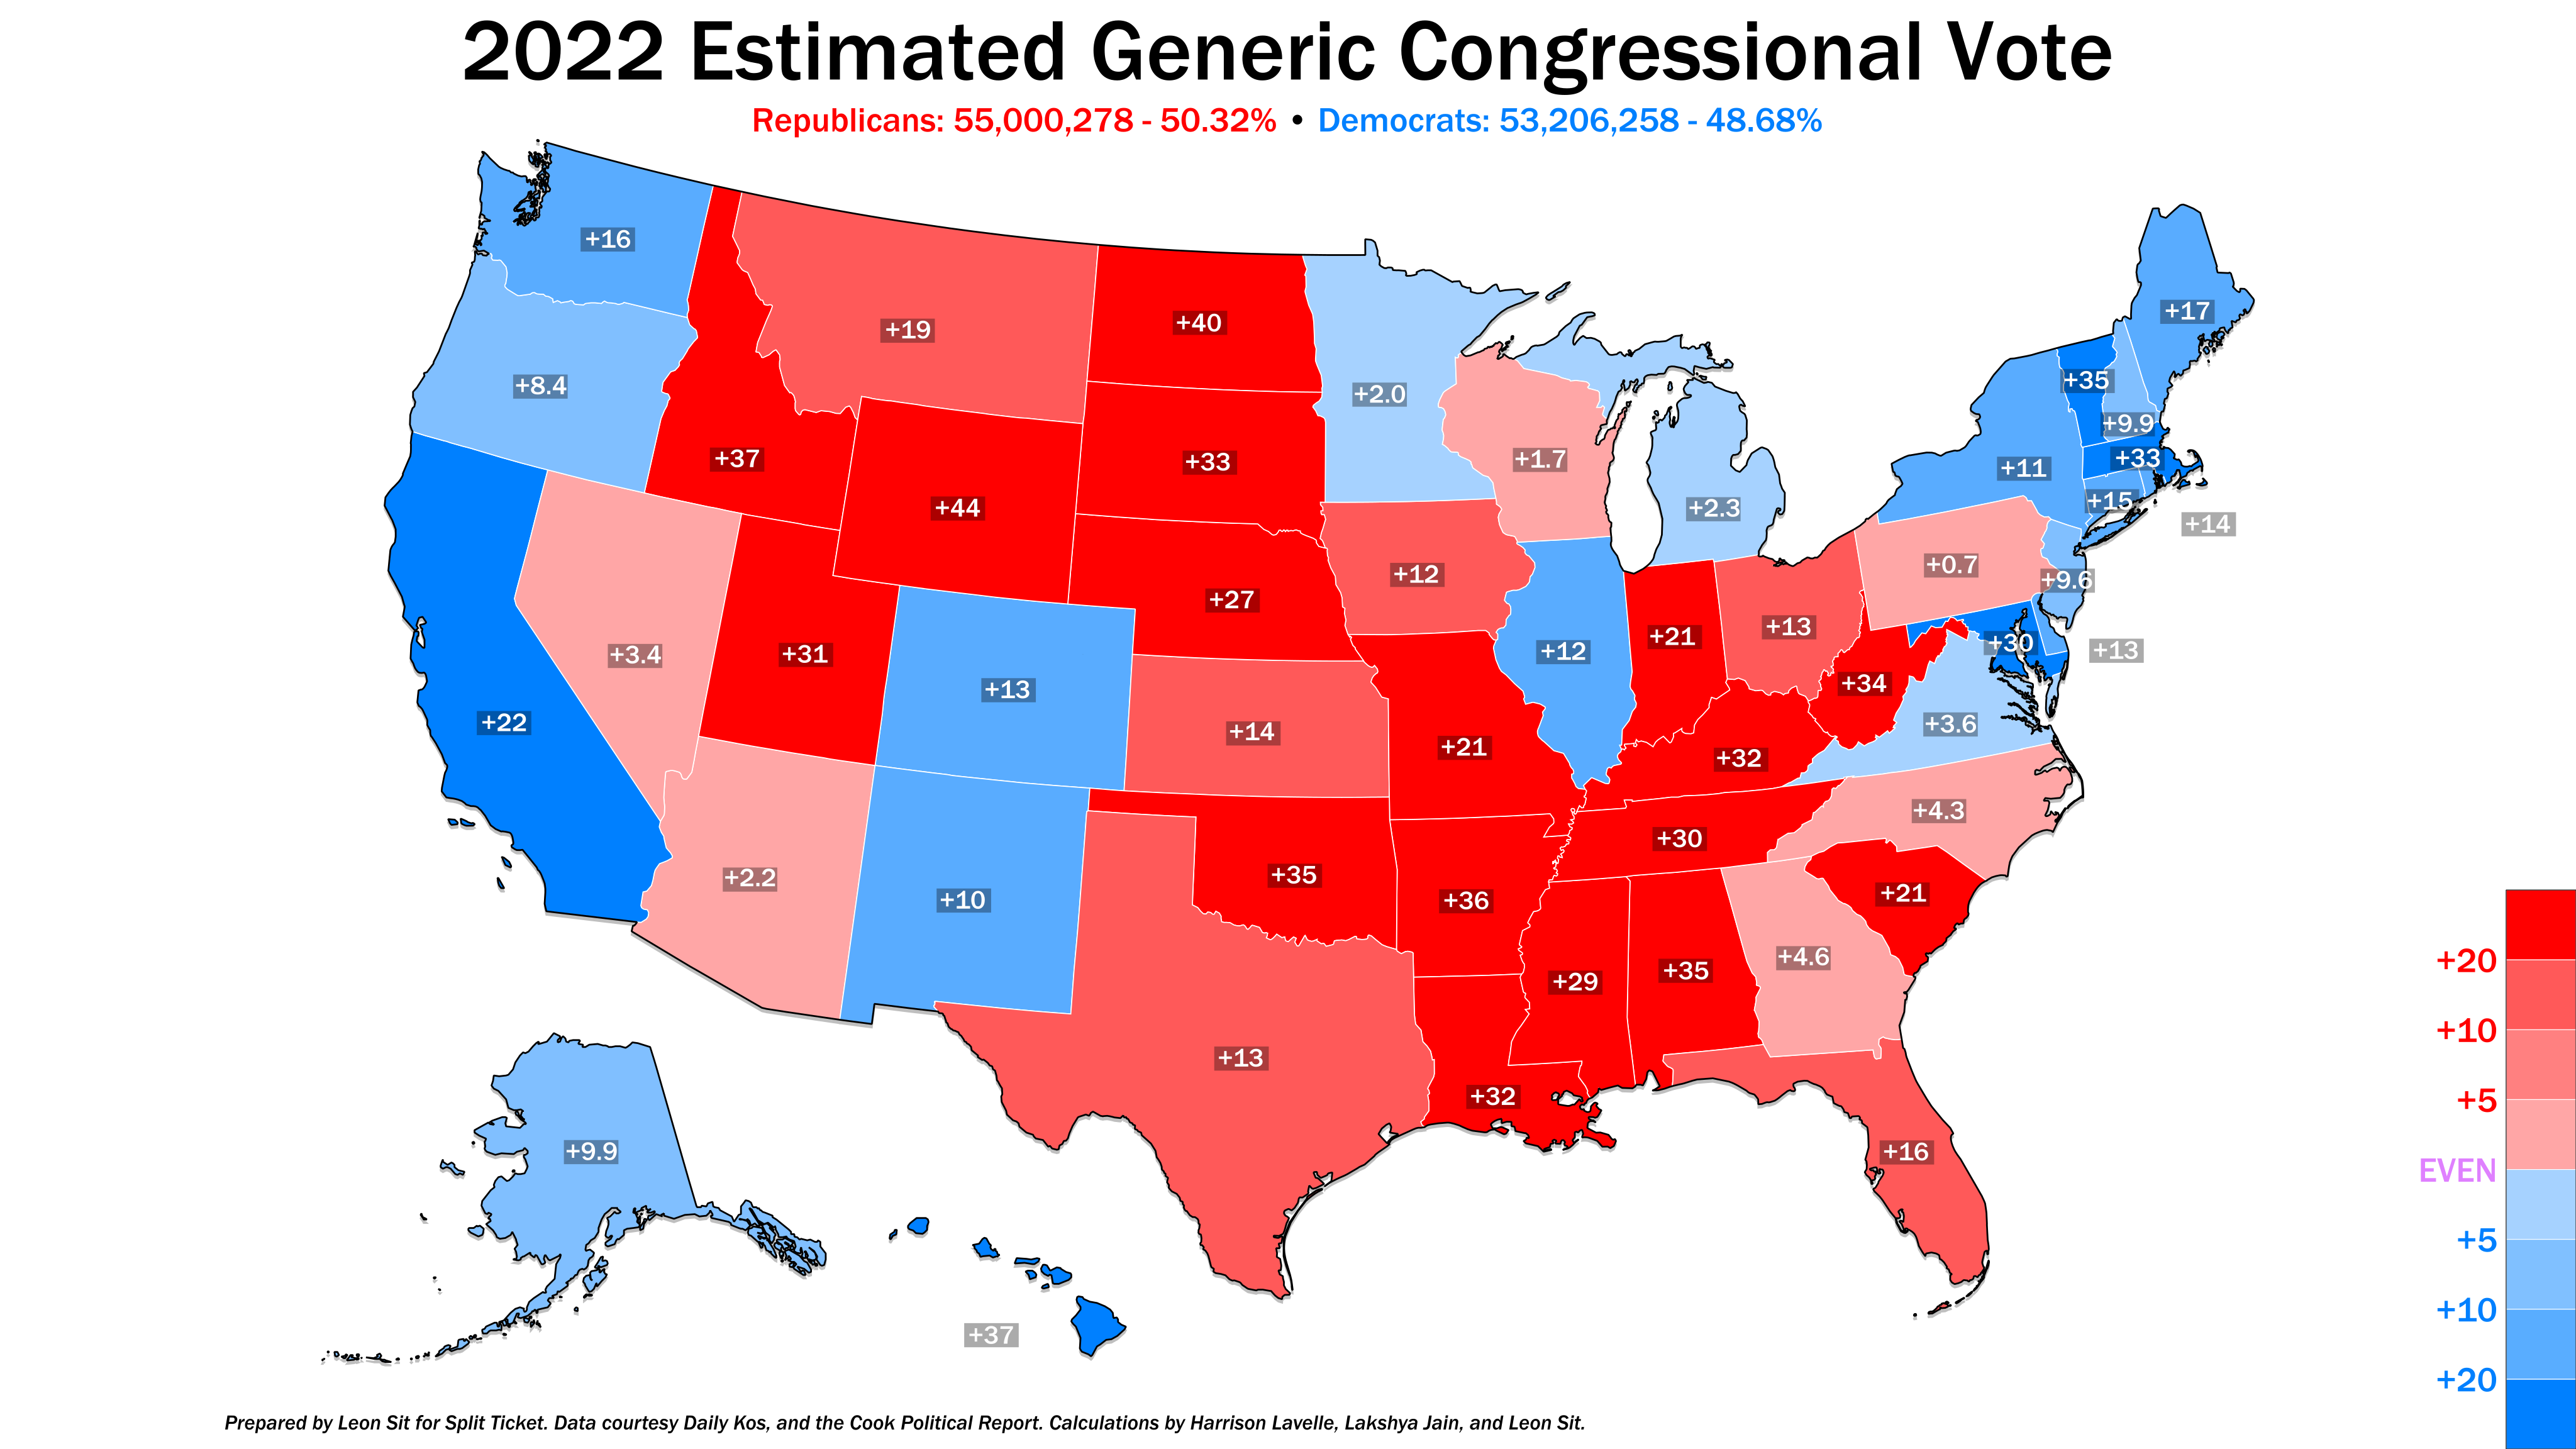
INTRODUCTION At the beginning of the 2022 cycle, one political truism benefited Republicans above all else: the out party had gained ground in all but three midterms since 1862. During that time frame, the House of Representatives had changed hands in 13 such cycles, with the presidential party often suffering… Read More
-
Georgia Senate Runoff Preview
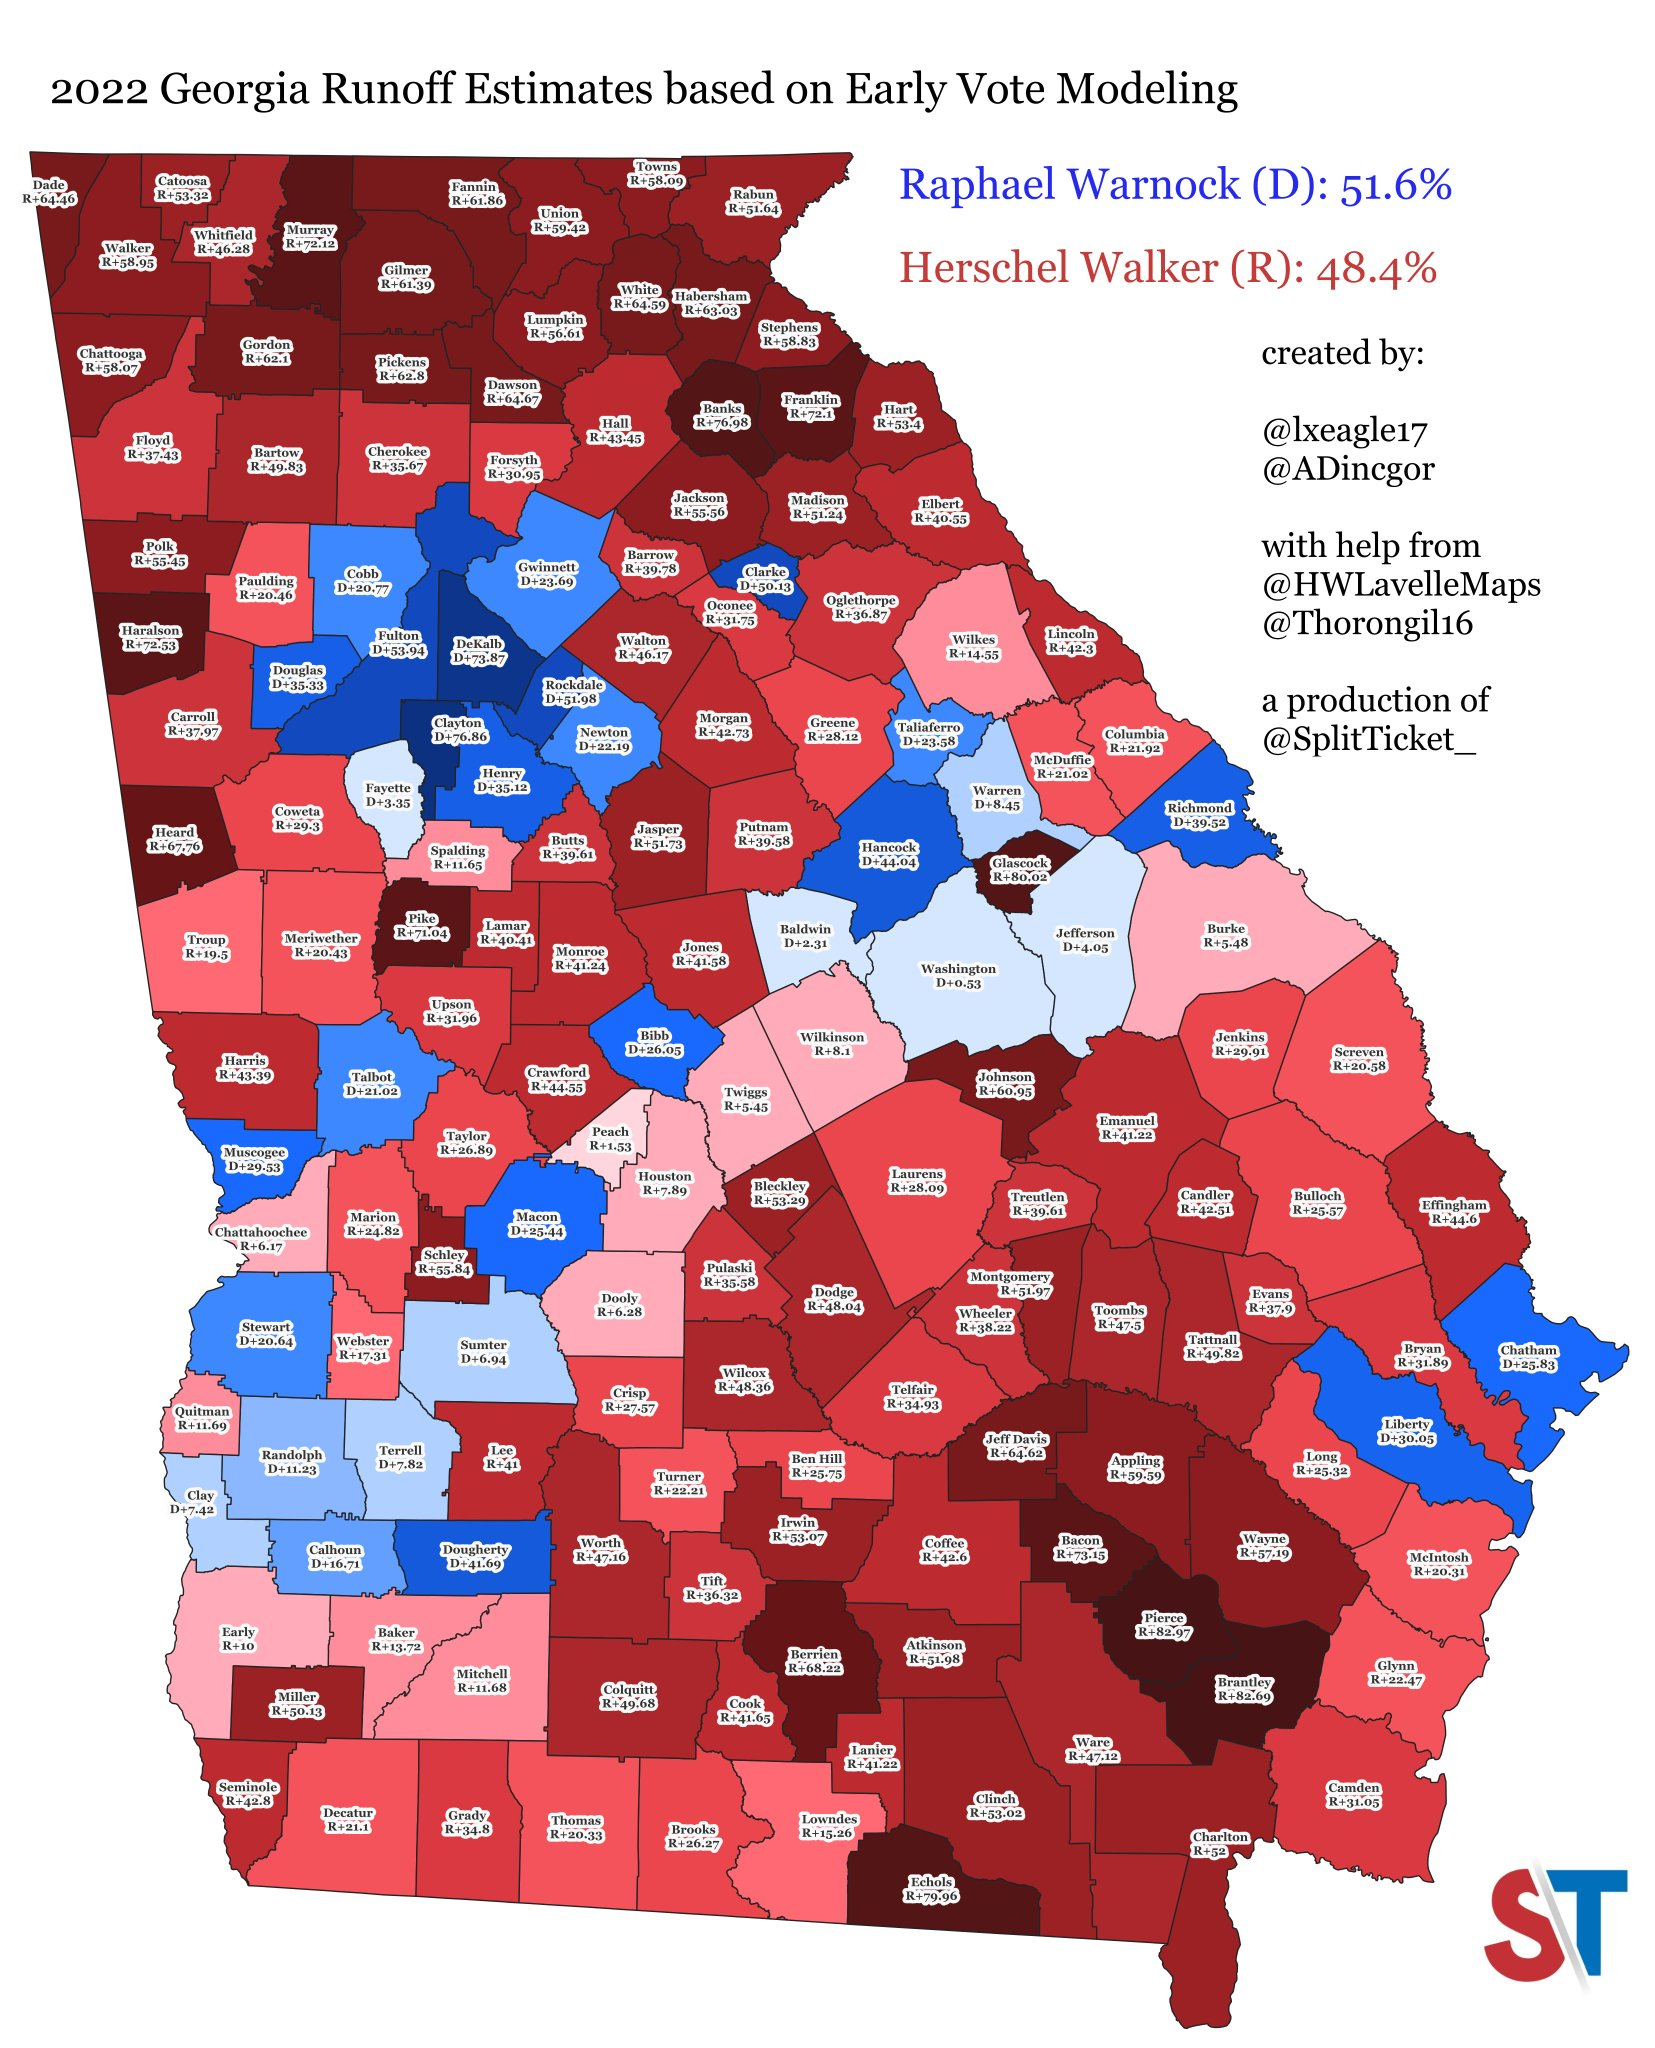
On Tuesday, Georgia voters will go to the polls for the Senate runoff election, which was triggered by no candidate getting an outright majority in the November general election. Incumbent Democratic senator Raphael Warnock will face off against former UGA football star Herschel Walker, and with Warnock having led Walker… Read More
-
A Nonpartisan Generic Ballot Aggregator
It’s increasingly well accepted at this point that Democrats are on track to have a fairly bad year, at least in terms of the national popular vote. Their president’s approval rating is at 44%, the out-party shows serious enthusiasm, and inflation is at 8%. None of these things generally point… Read More
-
What’s Going On With Trafalgar’s Polls?
Over the last two presidential cycles, the Trafalgar Group rose to fame for its polling, which yielded better-than-average results for Republicans and indicated closer races for Donald Trump than many other outlets predicted. Trafalgar partly attributes those numbers to its “social desirability metric”, which the firm claims adjusts for respondents,… Read More