For years, we’ve talked about candidate quality at Split Ticket, and about the inferences we draw from our modeling. Broadly, these are conclusions that are in step with what most political professionals and survey practitioners alike express: moderates generally tend to do better, and that gender and race don’t strongly tilt the playing field in either direction by themselves.
At the same time, I recognize that we’ve only lightly explained what actually goes into such a model. Until Strength in Numbers released their recent model, I don’t think anyone else did this so comprehensively in the public domain, either, so this essentially means we’ve asked you to just trust our findings for three years.
So I think it’s time we explain, in detail, what Wins Above Replacement (WAR) really is. The simplest way to do this is to deconstruct our 2024 WAR model for you and explain how it works.
WAR is basically the result of a regression model that predicts the difference between the congressional margin and the presidential margin using a few structural factors that have universal impacts. The difference between the actual performance gap and what is predicted by the regression is called the residual of the model — we’ve just given it the name of Wins Above Replacement. Let’s break down what these important factors are.
The first thing we consider is incumbency. This is one of the most well-documented and well-studied features in American politics: incumbents generally do better, as shown by both Gary Jacobson and Andrew Gelman. While its importance has declined over time, virtually every study still finds that it matters — in 2024, its impact was 3%.
So let’s say you’re modeling a race in a Harris +3 district that a Democratic incumbent won by 4%. On the surface, this may look like a Democratic overperformance. But when you consider that across the country, incumbents were supposed to outperform the presidential candidate by 3%, it doesn’t sound as impressive, does it? Suddenly, you realize that someone is less capable as an incumbent candidate than you might think. And our model accounts for this.
The second thing we account for is the lagged presidential vote of a district, and the way the district swung. For instance, in 2024, we consider the 2016 and 2020 presidential margins and feed in the 2016-24 swing and the 2020-24 swing into our regression model. (Readers may recognize this as the term “downballot lag”.)
Why is this important? It is because realignments always begin at the top of the ticket and flow downwards from there. It’s a big reason people like Vicente Gonzalez represent Trump-won seats that Biden won by double-digits, or why Barbara Comstock’s Romney +1 district re-elected her by 5 while simultaneously backing Hillary Clinton by a healthy margin. The importance of this factor is extremely well-documented by people like Andrew Hall and Daniel Thompson.
As any behavioral scientist would tell you, identities are hard to shed. In a similar way, voters do not abandon their attachment to their party all at once in big realignments. Instead, this change generally begins at the top: first, they consider themselves a “Trump Democrat” or a “Republican for Hillary”. Then, over time, they slowly realize that their preferences and beliefs are more aligned with their presidential choice’s party, and they begin to vote accordingly. But it takes some time for a “Trump Democrat” to become a straight-ticket Republican, and it generally doesn’t happen in the same cycle.
In our model, this tends to explain a good chunk of the overperformance observed in many nonwhite seats. Here’s an example: Ritchie Torres saw his heavily non-white seat swing right by approximately 22% between 2020 and 2024, and by 33% between 2016 and 2024. Our model estimates that a district like his should be giving a generic, non-incumbent Democratic congressional candidate 6% more in margin than it gave Kamala Harris. When you add in incumbency, this expected overperformance is more like 9%. This is the main reason Ritchie Torres is graded as a WAR underperformer, despite outperforming Harris by 8. We simply expect Democrats to perform better than Harris on the congressional level, due to this well-accepted phenomena of downballot lag that is known to persist.
These are the two biggest factors that impact the WAR model, and account for the vast majority of a candidate’s WAR score. You could create a very close approximation of WAR from this alone. We have two other factors for spending and demographics, but their impacts are quite minor, and deleting them from the model would not change the model much, nor would it impact the directional findings in the slightest (in fact, in 2024, accounting for those factors actually helped progressives improve their WAR by a tiny bit!). You can see the appendix for more details if you’re curious.
Now that you know how to essentially reconstruct our WAR model, let me address Jake Grumbach’s and Adam Bonica’s concerns.
Concern #1: WAR does not have a strong correlation with the raw gap between congressional and presidential margins.
Among the largest concerns that Grumbach and Bonica share is that WAR does not correlate very strongly with the raw gap between the presidential margin and the congressional margin. (In other words, if Alexandria Ocasio-Cortez won an election by 38% while Kamala Harris won her district by 32%, the “raw gap” would be 6%”
This is not that surprising. This is because WAR is, at its core, the residuals of a model trained to predict the gap between congressional and presidential margins based on structural factors. Whatever is left over is called “WAR”. This complaint boils down to “their WAR model attributes a lot of overperformance to structural factors, rather than the candidate itself”.
I agree with that assessment, but this is a feature, not a bug. The model is simply saying that structural factors explain a lot of the raw overperformance that exists. Grumbach’s statement that this leaves room to “stack the deck” in favor of moderates is, essentially, a complaint over the fact that we are controlling for two of the most basic variables in political science: incumbency and lagged partisanship, which explains a lot of the raw overperformance.
Concern #2: The model’s results are biased in favor of moderates, because WAR correlates with moderation.
One concern Jake and Adam share is specifically that if you evaluate WAR’s divergence from the raw delta between the House and presidential results, you see a heavy correlation with moderation.
This is actually extremely easy to explain and arises from an elementary gap in logic. WAR is the result of a model that is designed to predict the gap between the congressional and presidential margin. It is basically saying “how much of a candidate’s overperformance cannot be attributed to structural factors (such as incumbency and lagged partisanship)?”
A big reason that candidates in diverse districts (especially deep-blue, urban cores) actually outperformed Harris in terms of raw vote share was because of downballot lag: their seats swung substantially towards Trump. Thus, once you control for the impact of downballot lag, you find that these results are a lot less impressive than you might originally expect. Though this doesn’t only impact progressives (see: Ritchie Torres), it does impact their WAR scores more, because more progressives represent more of such seats. This is a big reason that WAR correlates with moderation so much.
Note that neither incumbency or lagged presidential vote are controversial factors to account for. Interestingly, Bonica himself pointed out the importance of the latter when identifying the flaws in a previous study on the electability of moderates, which failed to control for this important variable. Similarly, Gelman and Jacobson have documented the impact of incumbency in congressional races fairly extensively. (Alternatively, speak to literally any political practitioner and they’d tell you about these two factors.)
In any case, these are both extremely important and well-researched factors that impact the outcome of a race, because they get at fundamental voter behaviors: voters are more likely to back incumbents, and voters who switched presidential votes are more likely to temporarily stick with their historic party downballot.
In a nutshell, what Bonica and Grumbach are complaining about is that WAR correlates with moderation. But I don’t find this to be a flaw. That’s a finding of the model. In general, moderates seem to do better. The question is why.
Concern #3: The model is fitted on 2024 data.
I find this concern to be a bit preposterous. This argument basically boils down to this: “you shouldn’t control for the presidential topline in a district directly. You should instead predict the result using pre-election data, then evaluate the actual result against this pre-election prediction”. But the very nature of evaluating overperformance means you need to know what the results actually are before making an assessment.
Imagine that you’re trying to evaluate Mariannette Miller-Meeks’ performance in Iowa’s 1st Congressional District. You could look at the fact that she underran Trump by 8 as an incumbent, winning by just 0.2% in the process, as we do. Or, you could create a model to predict how well a candidate would do in that district that is blind to the actual 2024 presidential result, then evaluate her performance against that prediction. This is what G. Elliott Morris and Mark Rieke do.
Bonica and Grumbach think the second approach is better. We believe this is a fatal mistake. Let’s give an example.
Say your model sees a district where Biden got 82% in 2020, and it believes that while the incumbent House Democrat should get 83% in 2024, and that a replacement would get 81%. In this case, their WAR would be D+2 in vote share. Now, let’s assume that in reality, Harris got 79% in 2024 while the House Democrat got 78%. The Strength in Numbers approach doesn’t know this, so it still believes that the House Democrat has a positive WAR — after all, in the simulations, the House Democrat still outperformed a hypothetical replacement. But in truth, the model doesn’t know how to calibrate that performance against the real presidential number.
To properly judge overperformance, you have to consider the real presidential result in the process. Otherwise, you’d get a model that says bizarre things like “Mariannette Miller-Meeks was an overperformer” (despite winning a Trump +8 seat by 0.2%) while saying “Adam Gray underperformed” (despite winning a Trump +5 seat against an incumbent”, and I’m not sure any serious political practitioner would agree with this.
Concern #4: The findings suffer from survivorship bias: Split Ticket only considers moderates who won.
I want to be clear here: the graphics we constructed for the Washington Post included the results for all incumbents, win or lose. For instance, Mary Peltola is still counted in here, even though she lost.

Zooming out, it is true that the incumbent graphics we do construct for each cycle only consider pre-cycle incumbents, so folks who lost in previous cycles, like Collin Peterson, obviously won’t have a WAR score for 2022 or 2024. But WAR in any given cycle is evaluated for all two-way races. All candidates get a score, win or lose. It’s possible for overperformers to still lose, simply because of how red their seats are — but it doesn’t make their campaigns useless in what they tell us.
But that’s different from saying we only consider moderates who won. And you still gain a lot of value from looking at how incumbent progressive lawmakers do against incumbent moderates. The fact that there are fewer Blue Dogs is a function of the fact that ticket-splitting has plummeted, and so it’s much harder for a Democrat to win an R+15 seat.
But that doesn’t make moderation useless, nor does it mean moderates don’t overperform more often (whatever the reason for that overperformance may be).
Concern #5: Correlation is not causation.
Of course correlation is not causation. But that doesn’t mean you can’t make inferences based on what you know about the results, or about the patterns that you generally observe. And when you look at caucuses, you do see that the more moderate members of Congress tend to overperform in a given cycle, whether Republican or Democratic.

Bonica and Grumbach see the correlation analysis in this way:
Split Ticket’s logic is like saying all baseball players should change their names to Aaron Judge because he has the highest WAR score. It confuses correlation with causation in the most basic way possible.
But our logic is really more like this: Players who hit home runs tend to have higher WAR. That doesn’t mean you can’t have value without hitting for power, but in general, it tends to help. It’s similar with moderation in politics.
There is more to life than ideology. In 2024, there were strong progressives like Rashida Tlaib and Sylvia Garcia, and there were also weak or mediocre moderates, like Jim Costa and Ritchie Torres. But in general, moderates did better. While the model itself may not establish causation, you can still make your inferences based on the correlations you see, especially when supplemented with other data we know of.
Logic must not reject facts. Rigorous reasoning has to depend on empirical evidence to reach sound conclusions. The assertion that the model aims to “stack the deck” in favor of moderates is really just a basic misunderstanding of elementary political science on incumbency and lagged presidential vote. We’re comfortable with the model and the conclusions we have drawn from it. We are heartened to see its extra use, and we stand firmly by its methodology.
Appendix
We do have two other minor factors: “spending” and “demographics”. Spending is mostly just an indicator for whether a candidate had the financial support to even run a campaign — in 2024, if both parties spent above or below $1.5M in the election, we set it to be 0, otherwise we used the ratio of spending from both parties.
The net impact of spending in WAR is usually minor: the median race sees a WAR adjustment of less than a quarter of a percentage point, and over 95% of races see an impact of around 1% or less from it. In the most extreme case, the impact of spending was 2% in margin, and it came in Mike Johnson’s race in Louisiana, where Democrats didn’t make even a modicum of effort.
Of all the factors we have in our model, spending is the one I am most amenable to removing. The impact is already extremely minor in our model, and there exists a very good argument to exclude it: “strong candidates can spend and raise money, so it should not have any impact at all on candidate quality.”
The only reason it is still there is because I know how people interpret the model. Recall that the spending coefficient is zero for essentially all swing races, because both parties spend more than that dollar amount in every swing district in the country. The coefficient only plays a role in uber-safe seats, and here, the weight of a party apparatus is fully in favor of the party that holds the district. This can tilt the scales in their favor, because the opposition party often lacks the means to wage any real effort, and so we find it somewhat valuable to control for this. The variable essentially measures the question of “did this race have two parties trying, or only one?”. For incumbents, this helps readers learn more about their true strength.
We also add in controls for the demographics of the district. One has to do with the amount of white, college-educated voters in the district, while the other is the percentage of nonwhite voters in the district. The logic for this is as follows: different demographic groups tend to have different downballot behaviors, and it is useful to control for this, because it is a demographic level trait and does not have to do with a candidate. (For instance: relative to their presidential leans, white, college-educated voters saw more affinity for Republicans downballot than nonwhites did.)
In practice, the impact of this is also extremely minor. The median race sees a demographic adjustment of around half a percentage point, and over 95% of races see an impact of 2% or less in WAR. In the most extreme cases, the WAR change observed is 3%.
Taken together, the median WAR score would change by approximately half a percentage point if we excluded both spending and demographics from the model, and over 95% of WAR scores would change by 2% or less in this case. For those curious on what the directional impacts of these changes would be, it would actually help progressives.
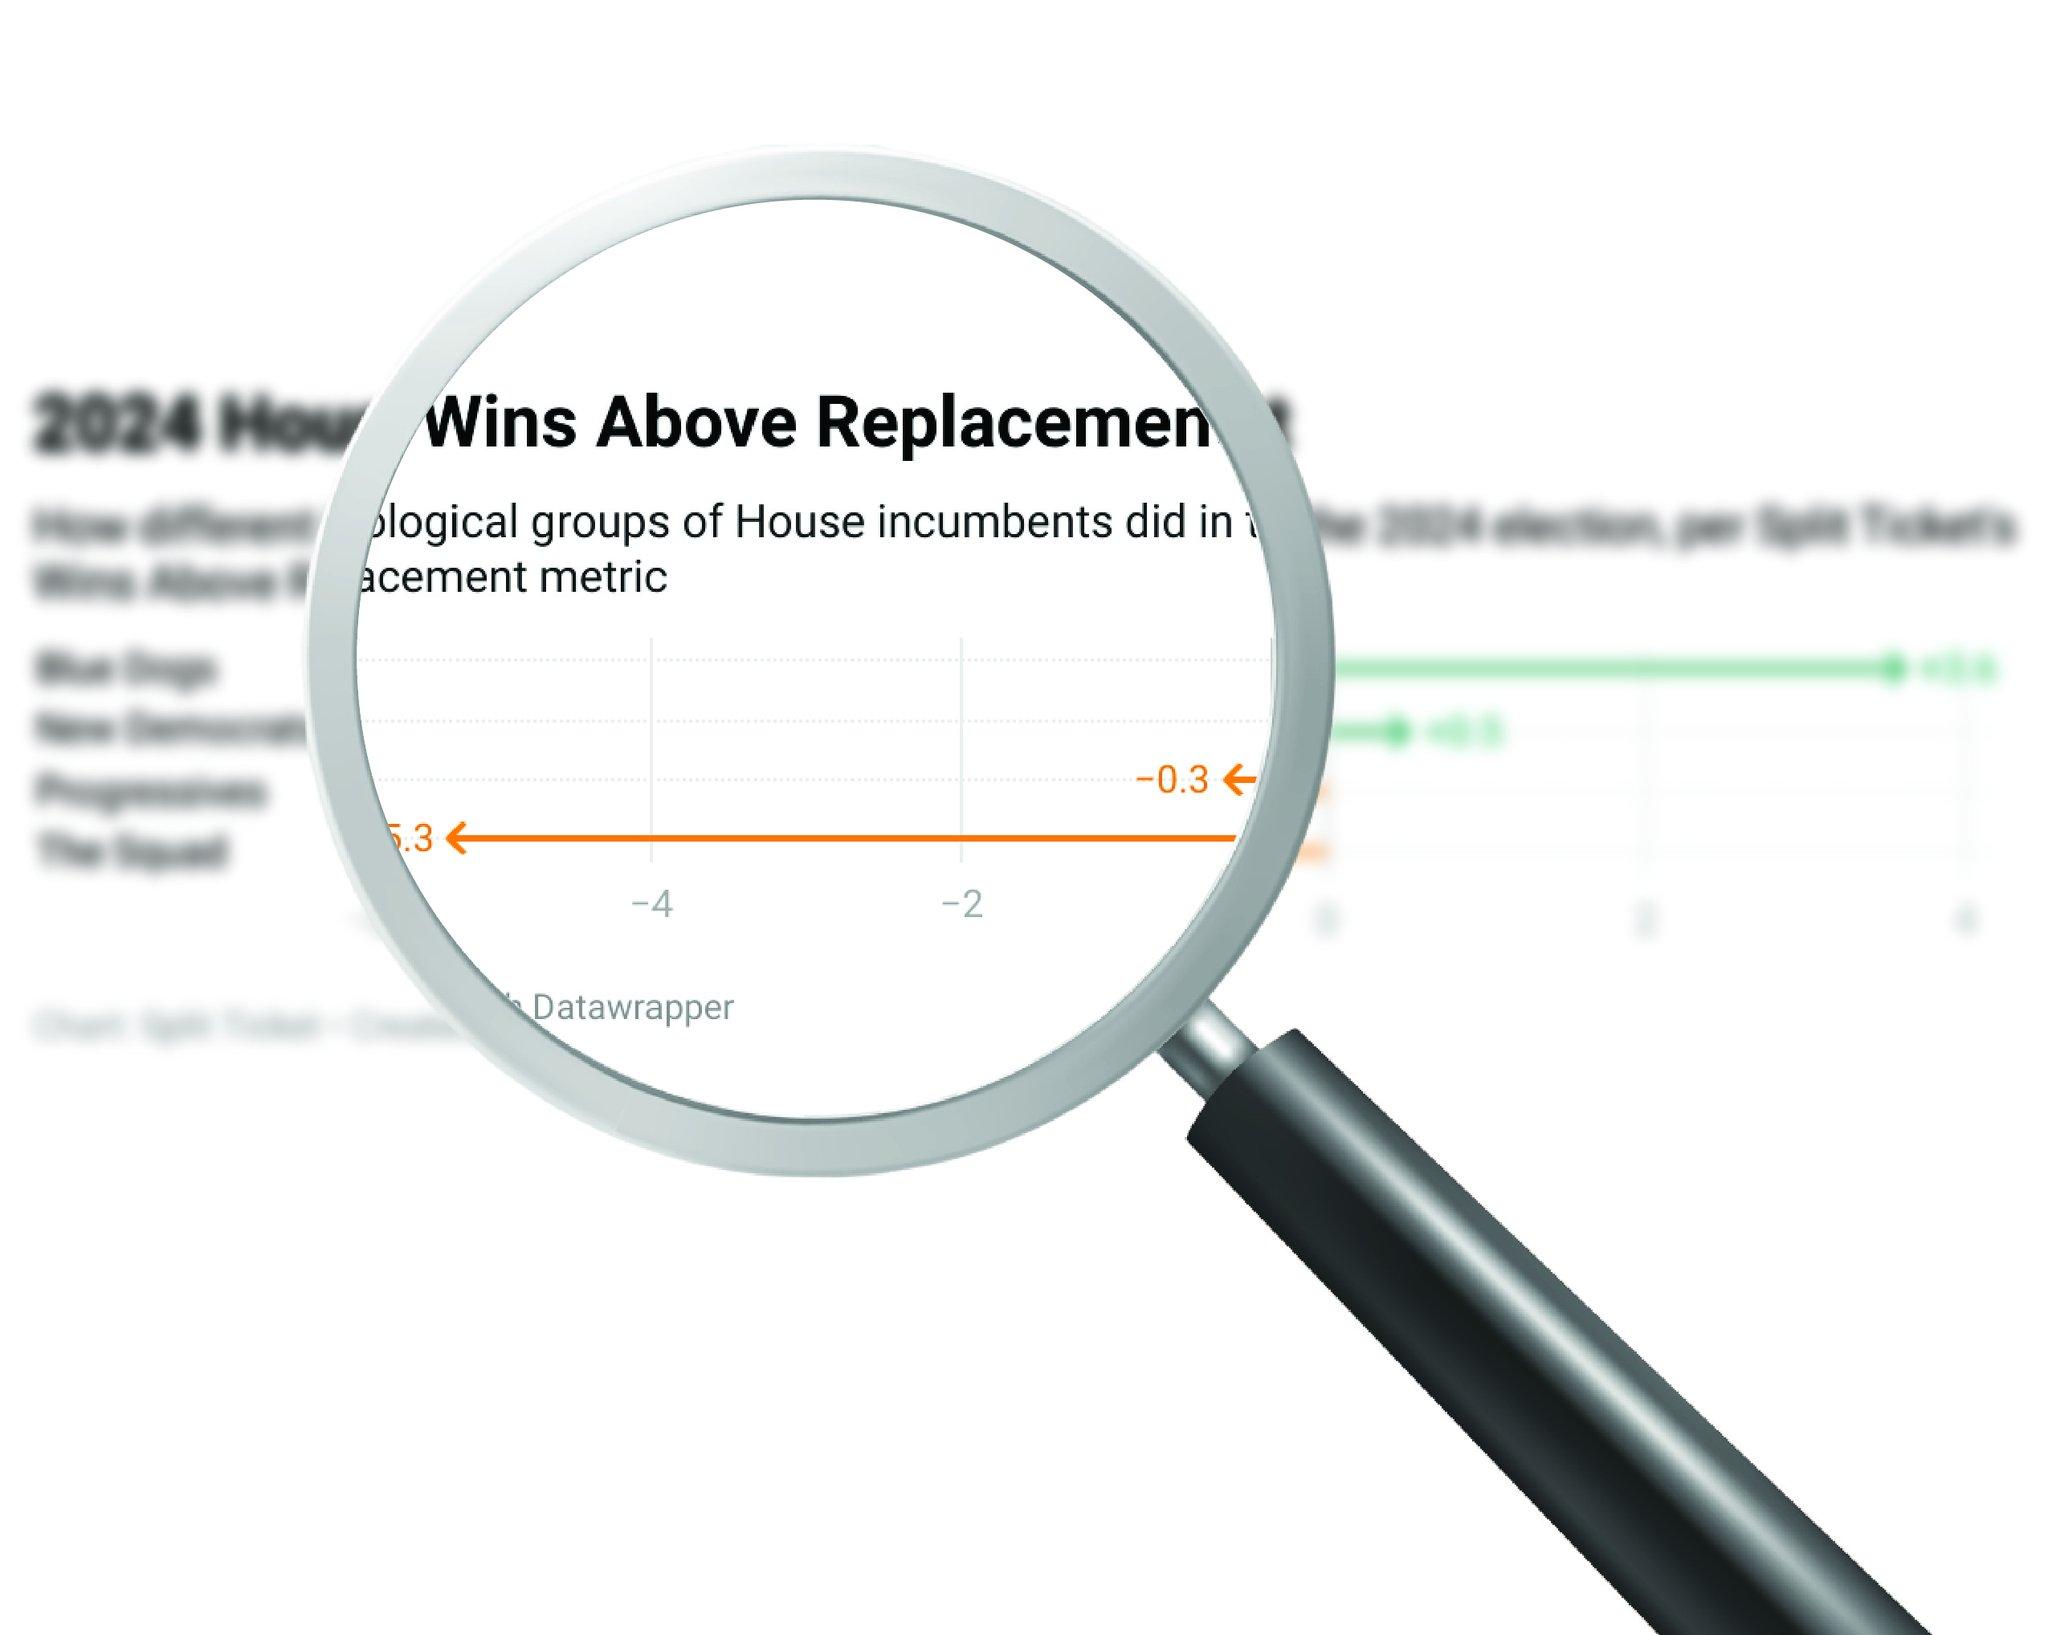
For instance, please consider the following caucus scores from the original WAR model:

Now, consider what the caucus scores look like in the “barebones” regression that has no demographics and no spending — just presidential swings and incumbency:

In any case, now you know what goes into our WAR model. We’re open to good-faith discussions on the design choices we’ve made — we just hope you understand the rationale and the effects behind each one. The choices don’t stem from a place of bias. They come from a desire to account for (mostly well-known) structural political effects that help explain voter behavior across the board.
Editor note: this piece was updated on August 15 to give an example of the pitfalls of not using the real presidential results from 2024 with a more accurate description of the Strength In Numbers methodology, after a conversation with Strength in Numbers’ WAR co-creator Mark Rieke.
I’m a computer scientist who has an interest in machine learning, politics, and electoral data. I’m a cofounder and partner at Split Ticket and make many kinds of election models. I graduated from UC Berkeley and work as a software & AI engineer. You can contact me at lakshya@splitticket.org