Turnout may be the political world’s favorite buzzword. If you’ve ever heard a campaign say that “it’ll all come down to turnout,” you’ll know it has long since become a cliche. Whether they win or lose, candidates often credit (or curse) turnout. Case in point: the 2024 presidential race. Many observers pegged poor Democratic turnout as the primary cause for Kamala Harris’s loss to Donald Trump.
It will come as a surprise to many, then, that “turnout” often lacks a clear definition. There are many ways to look at turnout, ranging from the simplest raw vote totals to complex analyses using voter files and turnout rates from different hypothetical pools of voters. For the purposes of this article, turnout is calculated using the percentage of the citizen, voting-age population that voted in 2024. This allows for a comprehensive overview of the entire country, and a consistent method to calculate turnout across states that heavily vary in election administration and accessibility.
These estimates are not always perfect, as they rely on citizen voting-age population datasets from the Census, which can often be noisy, particularly when it comes to smaller counties. We encourage readers to focus on the broader picture, rather than individual counties, when it comes to our estimates.
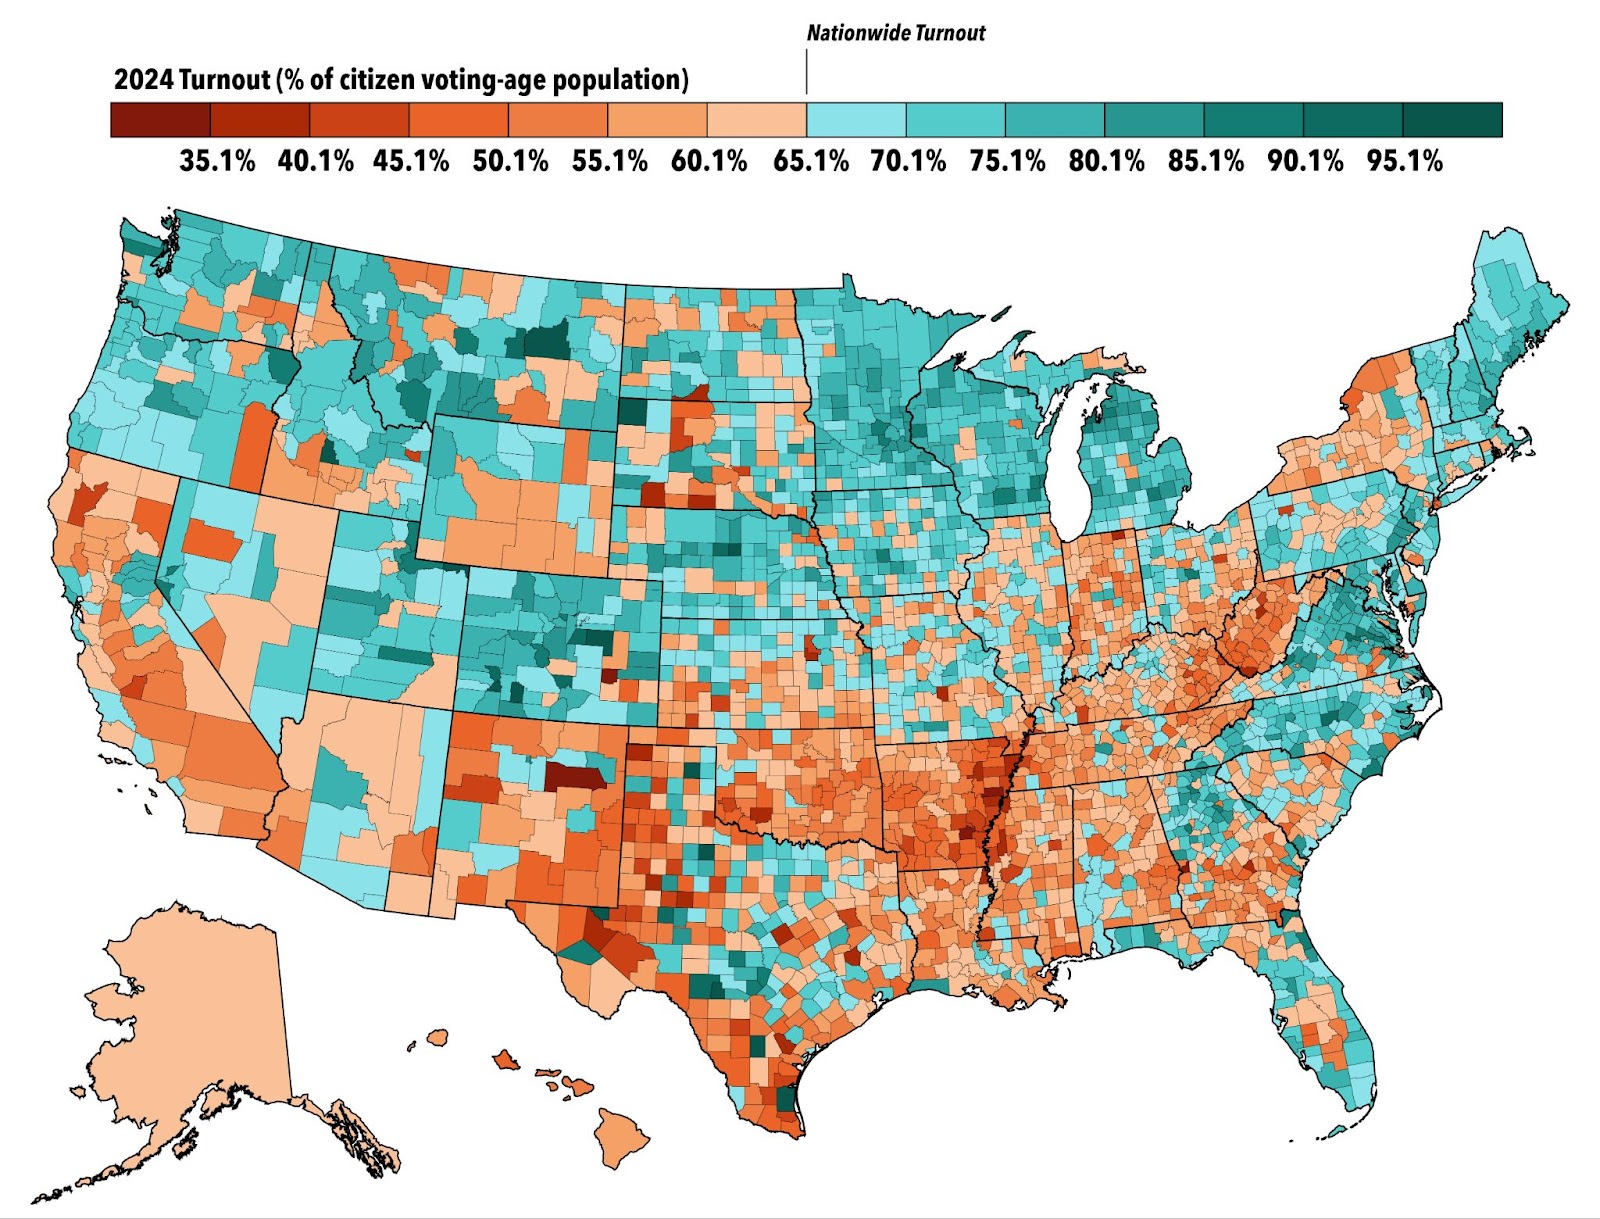
In 2024, 65.1% of all voting-age citizens cast a ballot in the presidential election. This is down slightly from the 67.9% turnout in 2020, but is significantly higher than most other recent presidential elections. Across the country, familiar trends emerge: wealthier, and more educated areas tended to have higher turnout. The north, particularly the Upper Midwest and the Pacific Northwest, similarly have higher turnout than Appalachia and the Black Belt.
None of this is unusual, and it all tracks closely with similar turnout trends from previous elections. To get a clearer answer on how turnout impacted the 2024 results, then, we have to dive deeper.
Trump’s Turnout Advantage

In terms of absolute turnout, there does not appear to be any particular correlation with partisanship. Counties that voted for Kamala Harris by 40 points or more had almost the same absolute turnout as counties that voted for Donald Trump by 40 points or more, at 63% for both. However, when we look at the change in turnout from 2020, a different picture emerges.
Trump +40 or higher counties were the only category to achieve greater turnout than 2020. Harris +40 or higher counties saw a decrease of 4.2 percentage points. The overall trendline shows that more Democratic counties generally saw worse turnout relative to 2020 than more Republican counties.
Of course, this does not directly tell us that being a Democratic voter was the primary cause of lower 2024 turnout. After all, partisanship is correlated with a number of factors that impact turnout, such as race and educational attainment.

In fact, we see a similar pattern when it comes to heavily white versus heavily non-white counties. Counties that are over 80% white saw a decrease of only 0.6 percentage points in turnout from 2020, whereas those that are less than 25% white saw a much larger decrease of 5.0 percentage points.
When we pair partisanship and race together, the pattern remains clear: Harris +40 or higher counties that are over 75% white saw a decrease of 3.5 percentage points in turnout. Harris +40 or higher counties that are less than 25% white saw a decrease of 6.4 percentage points.
Overall, then, the picture is fairly clear: Democratic counties and Democratic-leaning demographics saw declines in turnout that Republican counties and Republican-leaning demographics did not. This, of course, benefitted Trump. While Trump undoubtedly gained ground with minority voters, particularly in urban areas, lower nonwhite turnout also contributed to Democrats’ poorer performances.
Swing State Turnout Didn’t Cost Harris the Election
While the 2024 turnout landscape benefited Republicans more than Democrats in the aggregate, the story was less clear in the key swing states. Contrary to the popular narrative, turnout did not cost Harris the key “Blue Wall” swing states. Taking turnout in each state as a percentage of the citizen-voting age population, we see that turnout increased relative to 2020 in those three states — particularly in Wisconsin. These states also happened to have smaller rightward swings compared to states like New Jersey, where turnout fell considerably.

The above map hammers home the point. While turnout dynamics in swing states still suggest Harris had a turnout issue (visible in small turnout declines in the Democratic powerhouses of metropolitan Atlanta, Philadelphia, and Detroit) relative to Trump, the effect appears to have been considerably smaller than the precipitous drops in turnout seen in safe states.

Swing state turnout tended to match or even exceed 2020, while turnout in many safe states cratered. Given Trump’s narrow popular vote margin, and significantly lower turnout in Democratic powerhouses such as New York and California, it is tempting to suggest that turnout may have cost Harris the popular vote, if not the Electoral College.
However, persuasion and turnout are linked. Recent data from Pew Research Center backs up a variety of post-election studies that suggest nonvoters leaned toward Trump in 2024. Had those voters turned out, his victory would have been larger. While the scale of this effect is difficult to ascertain, the simple truth is that not every Biden 2020 voter who sat out 2024 would have been a Kamala Harris voter.
Persuasion Made the Difference
Turnout dynamics in 2024 were not positive for Kamala Harris, but persuasion also played a key role; Trump made enormous gains with traditionally Democratic nonwhite voters, and Harris failed to make significant gains with college-educated white voters.

One need only take a look at counties that are over 80% white versus those that are less than 25% white. The former group voted Trump +20 in 2020 and Trump +23 in 2024. A relatively minor shift, consistent with data that suggests 2024 saw little change among white voters. Among the latter group, however, Biden’s +33 margin in 2020 transformed into a much smaller Harris +17 in 2024. This kind of massive decline did significantly more damage to Harris’ chances of victory than lower Democratic turnout.
It should be noted that it is not a coincidence that turnout dropped among the same groups that Harris saw drastic losses with. In general, we find that turnout and persuasion are correlated. Many Biden voters who were not compelled by Harris (or found Trump more persuasive this time around) switched their vote, but others sat out altogether. After all, being persuaded to turn out is, in itself, a form of persuasion.
Consequently, we cannot conclude that if Harris had simply turned out those voters, she would have performed just as well as Biden had four years prior. Turnout dropped because these voters bolted from the Democratic Party, not the other way around.
I am an analyst specializing in elections and demography, as well as a student studying political science, sociology, and data science at Vanderbilt University. I use election data to make maps and graphics. In my spare time, you can usually find me somewhere on the Chesapeake Bay. You can find me at @maxtmcc on Twitter.
My name is Harrison Lavelle and I am a co-founder and partner at Split Ticket. I write about a variety of electoral topics and handle our Datawrapper visuals.
Contact me at @HWLavelleMaps or harrison@splitticket.org