
For people who want non-polling electoral signs, the Washington primary election has been perhaps the most closely watched signal in recent years. This August “jungle primary” pits Democrats and Republicans against each other on the same ballot, with the top two vote-getters advancing to November, regardless of party.
The nature of the primary, both in structure and in timing, means that it has been quite revealing of how the nation has voted in the past. As a result, this year’s results have brought a lot of Democratic cheer, because the House popular vote in the state sits at D +16. This marks a 2% improvement on 2020, when Democrats won by 14% in the primary and 2.1% nationally down-ballot in November, and a 5.6% improvement over 2022.
But while it’s clear that the primary points to Democrats improving on their 2022 performance, the magnitude of this shift matters in addition to the direction. For example, a D+2 national environment is very different from a D+5 one — the former likely implies a tight election with a probable, slim Democratic House majority, while the latter probably results in a comfortable Kamala Harris win with a potential trifecta.
A popular way of reading Washington’s primary results is through using something we’ve jokingly dubbed “the rule of 12”, where observers take the primary results and simply shift them 12% towards Republicans to determine the national November result. Such a method would point to something closer to the “sizable Democratic win” scenario. But while this has worked recently for a variety of (somewhat unique) reasons, it is not exactly a robust method of analysis and has the potential to significantly mislead. That’s why we decided to conduct a more detailed statistical analysis, controlling for demographic differences and trends.
Our findings suggest these results are consistent with a small Democratic down-ballot edge, and they point to perhaps the best down-ballot environment Democrats have enjoyed since the blue wave of 2018. But they still point to a closer election than the “rule of 12” would suggest.
Washington has unique demographics: compared to the rest of the country, it is more white and marginally more educated, with a more concentrated and urbanized population. That’s especially true in the area surrounding Seattle, which contains a large chunk of the state’s population. These demographics have also been trending left at a rapid pace, especially in the post-Dobbs era.
This means there is a possibility that the correlation between the statewide primary results and the eventual House vote could weaken, as the state might trend differently from the nation as a whole. In other words, it is possible that Washington could theoretically experience a state-specific leftward swing not mirrored across the rest of the country, which would make the primary results less predictive than it has been recently. If this were to happen, could the typical average primary-to-general shifts still hold as much predictive value as they once did?
This question can be answered by a more focused look at Washington’s primary that controls for demographic differences more likely to fuel a leftward trend. Instead of viewing Washington’s results as a whole, let’s exclude the Seattle area of King, Pierce, and Snohomish counties, which contain roughly half the state’s population. By excluding this portion, we can get a glimpse into an electorate that much more closely resembles the nation.
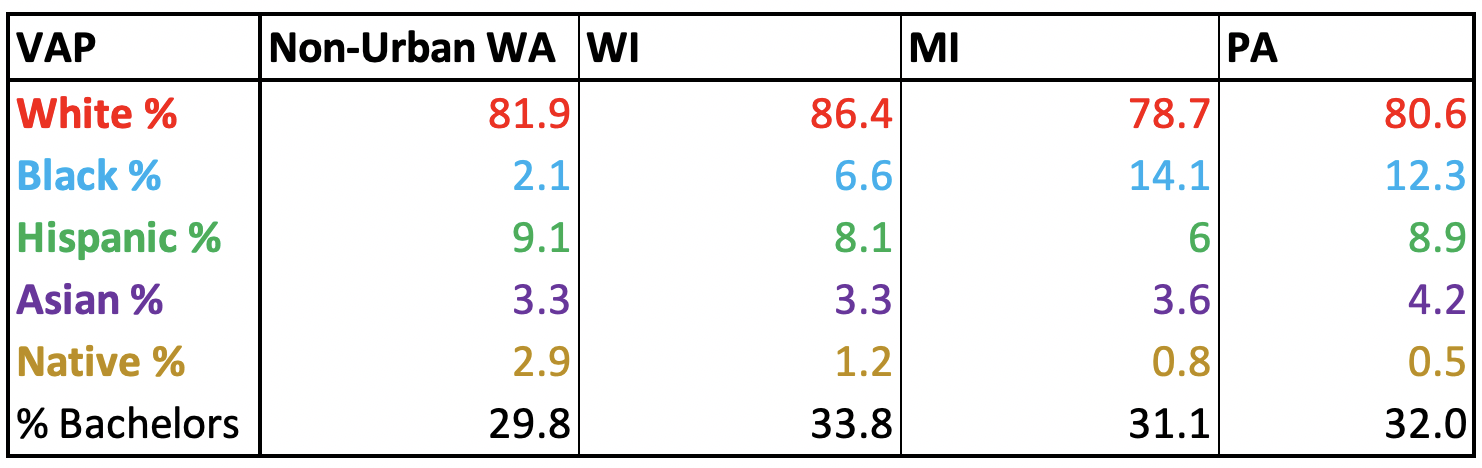
This remaining area is decidedly more rural, whiter, and less educated than the state as a whole. That remaining population—what the table below refers to as “non-urban” Washington—is more or less demographically consistent with the Midwest.
Non-urban Washington has not rocketed left of the nation to the same degree that its urban counterpart has. Part of this is that while the state itself has a 38% college attainment rate, it really is a tale of two electorates: the 3 urban counties have a 45.2% attainment rate while the non-urban slice we are examining is stuck at 29.8%. As educational polarization continues, this rate slightly lower than the national average (34.3%) implies a lower susceptibility to leftward trends.
Critically, the secular, non-college, and white balance of the area makes it remarkably similar to the Midwest, making it an excellent bellwether for the nation’s critical swing states.
For example, in 2012, Washington as a whole had a D +4 vote in the House primary. In 2016, that number ballooned to D +15.5. But in non-urban Washington, Democrats collapsed, as the area went from R +4 to R +9.5. The primary numbers in non-urban Washington were the canary in the coal mine, predicting that Clinton would collapse in the Midwest relative to Obama, even as she made gains in highly educated urban areas like Seattle and suburban Atlanta.
There’s another interesting wrinkle in this. Non-urban Washington hasn’t just tracked the Midwest — it has consistently predicted the national environment as a whole. This part of the state has been roughly 7–10% to the right of the eventual national House vote. When accounting for the Third and Fourth Congressional Districts’ swath of Democratic votes for GOP incumbents due to their votes to impeach Donald Trump in 2022, the numbers likely have an even more consistent range.

On balance, the results this year contain good news for Democrats. Currently, non-urban Washington is voting R +5.5, about 1.3% more Democratic than how the area voted in 2020, and that points to a modestly bluer down-ballot environment this time around.
This leftward shift is important for two reasons: first, it shows that there was a blueshift across the state, not just limited to the high-turnout liberals of the Seattle metro. Secondly, because the more Midwestern-resembling areas of the state had modest leftward movement, observers could read it as a potential sign of a strong Democratic performance in the non-urban North.
That would be in line with most of the polling we’ve observed, where Michigan, Wisconsin, and Pennsylvania are now voting closer to the national popular vote than they did in 2020. And if the Washington primary’s portents continue to stay true, marginal leftward shifts in more evenly divided and less educated areas such as the Midwest should hold water for Democrats.
Naturally, there are reasons why reading the tea leaves of a primary election could fail. Perhaps the foremost of these is the way a primary election could be unrepresentative of the general electorate. Although the Washington primary has historically tracked well with the national popular vote, a November electorate that is expected to be less college-educated than the primary electorate could also skew more toward the preferences of those non-college voters, which in recent years has increasingly invoked “Republican”. This is the case even in places with lower rates of college education, where there are in fact more non-voters to turn out in the autumn than in places where most voters are already coming out.
Additionally, prior performance does not guarantee future results. Although the statewide blanket primary encourages voters of all partisan affiliations to turn out and has previously reflected the will of Washingtonians well, the fact is both the exact composition of the November electorate and even potential changes of mind are not accounted for in these results.
Additionally, as this portion of Washington does not have a large proportion of nonwhite voters, it is less prone to seeing huge turnout differentials and partisan deltas between frequent voters and nonvoters that have been often talked about. In either case, Kamala Harris does significantly better with 2020 nonvoters than Joe Biden does, so if there is a surge of low-propensity voters in November that does not resemble the primary composition, it is possible that it would not hurt her by nearly as much as it would have hurt Biden, which improves the predictive value of this tool.
The last point to make is that while the Washington Primary is more predictive of down-ballot elections, the spike in polarization has resulted in increased partisan stratification across the ballot. Additionally, Harris herself actually outruns congressional Democrats in the polling averages now (a reversal from when Biden was on the ballot), and the final result will not likely see House Democrats sailing to a majority while the top of the ticket struggles. While it is worth using an abundance of caution, it is also important to read the data for what it is, and it suggests a slight Democratic advantage for November at the moment.
Having addressed the many caveats above, if historical trends hold, Washington’s true bellwether arguably predicts a national House vote favoring Democrats by roughly three points, slightly bluer than 2020. This is a signal that the House may be likely to flip back to Democrats. But there is still a long way to go, and every indicator we do get until the election will always be an imperfect one.
I’m a political analyst here at Split Ticket, where I handle the coverage of our Senate races. I graduated from Yale in 2021 with a degree in Statistics and Data Science. I’m interested in finance, education, and electoral data – and make plenty of models and maps in my free time.