Joe Biden won the 2020 presidential election with a margin quite similar to that of the 2012 reelection of his predecessor Barack Obama — 4.5% and 3.9%, respectively. However, his coalition differed from Obama’s, having been the product of nearly a decade of electoral change. Many counties moved in one direction — for example, most white, rural, working class counties moved sharply to the right and did not see a significant rebound in 2020. Some moved in a different direction in 2020 than they did in 2016, but only by a point or two, leaving their broader trends unclouded.
However, there are exceptions to every rule. Some counties shifted substantially in one direction in 2016, only to reverse course in 2020. These counties may still have moved significantly relative to 2012, with one cycle’s shift being appreciably greater than the other’s. Others featured swings have more or less canceled out, leaving counties right where they were in 2012 despite the political shifts of the intervening eight years. What these politically fickle counties do this November may end up determining control of the presidency.

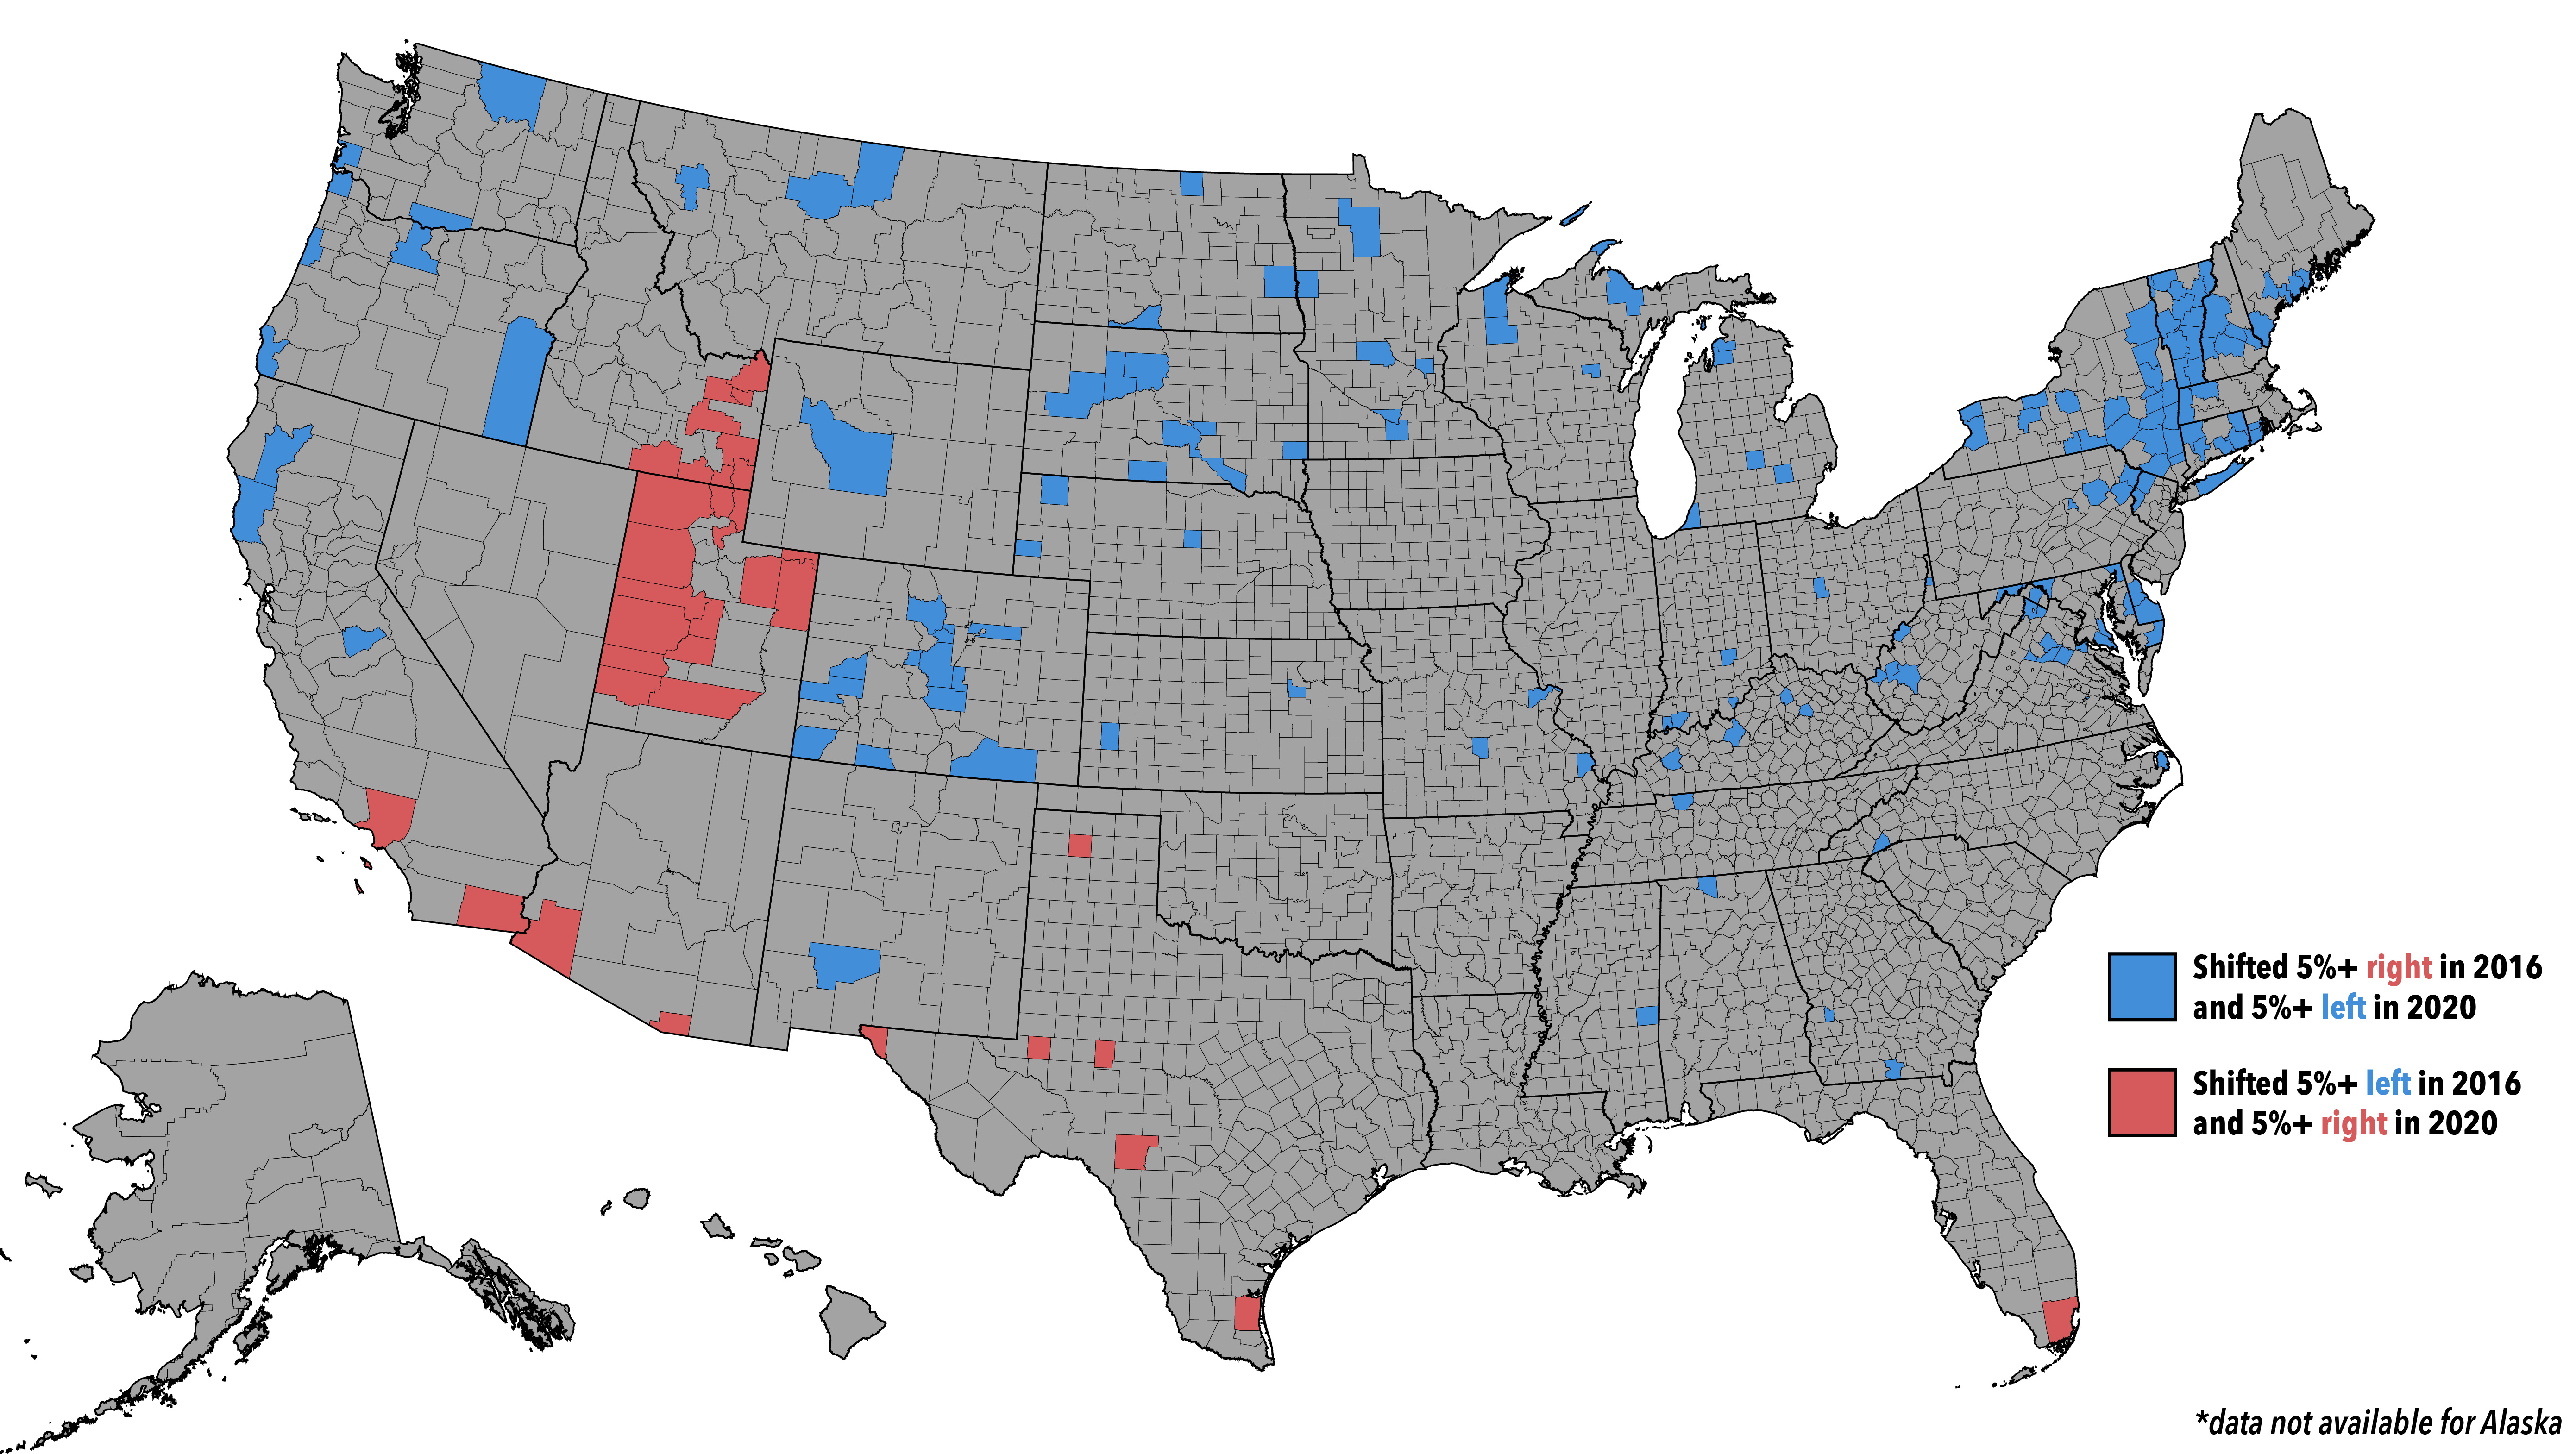
Counties that shifted more Republican in 2016 & more Democratic in 2020.

These counties saw significant shifts toward Trump in 2016 before Biden rebounded in 2020. There are a wide variety of counties that fall into this category, and education is less of a dividing line than one might assume. There are three sub-categories here: the Secular Rurals, the Exurbs & Smaller Cities, and the Native American North.
The Secular Rurals
This category is broadly composed of rural or non-metropolitan counties in the north, especially in the northeast. Some are “touristy” counties that attract wealthier, seasonal populations, such as the Charlevoix County in northern Michigan, the Berkshires in Massachusetts, or coastal Sussex County in Delaware. They are almost universally places that are very white, and most are less religious than the nation. This effect can be most seen most prominently in the northeast, with the caveat that Bernie Sanders write-ins may have uniquely deflated Clinton’s margins in some Vermont counties. In New England and Colorado, they often have higher than average college-education levels, but others, such as the more working class counties in the Pacific Northwest, do not.
Unfortunately for Biden, these counties are disproportionately concentrated in states that are already safely Democratic. His surge in these places contributed to a resurgence in Democratic margins in states like Connecticut or Maine, but some crucial states, like Florida or Arizona, are devoid of them entirely. Nevertheless, their presence in New Hampshire and Colorado pulled the two swing states that Clinton struggled to win in 2016 off the playing field for Trump.
Secular whites, particularly those in the north, are one group that is quite pro-choice and generally stayed loyal to Democrats in 2022, and they could potentially be Biden’s best group of the three, at least relative to 2020.
The Exurbs & Smaller Cities
This category shares quite a few similarities with the Secular Rurals, and some counties blur the lines between the two categories. As with its preceding category, these counties tend to be very white. Counties in this group are distinguished either by their connection to a metropolitan area, or by being home to a small city themselves. They are scattered across the broader east, with only one (Adams County, Colorado, a large suburban outlier in this group) being found in the west.
Education levels vary considerably here, as they did in the Secular Rurals. Most, however, are not too distant from the national average. The counties home to exurbs of larger metropolitan areas tend to be better educated, such as Suffolk County in New York, St. Charles County in Missouri, or Calvert County in Maryland.
Their swings in both directions is likely a reflection of the broader dynamics of 2016 and 2020; in 2016, Republicans gained with non-college whites while Democrats gained with college-educated whites. In these counties, which tend not to be very highly educated, this translated into Republican gains in 2016. In 2020, however, Trump failed to meaningfully improve on his performance with non-college whites in these areas, while Biden continued making Democratic improvement with college-educated whites — shifting this group back toward the left. In 2024, the direction these counties move towards may illustrate whether one of these demographic shifts is overpowering the other.
The Native American North
This group of counties is substantially different from the preceding two —they are universally less educated than average, and they have high Native populations, many of whom live on reservations. This distinguishes them from places like eastern Oklahoma or Robeson County in North Carolina, which have substantial Native populations that do not live on reservations. Neither of them appear on this map. Biden broadly improved over Clinton in many Native American reservations, although this was partially powered by a collapse in third-party vote share, which tended to be quite high among Native Americans in 2016. In North Dakota’s Sioux County, for example, Clinton won 62–21%, with 17% going to third parties. In 2020, Biden won here 75–24%, with third parties failing to crack 2%.
With the exceptions of Minnesota’s Beltrami County and Wisconsin’s tiny Menominee County, none of these counties are in states that will be competitive on the presidential level this November. The Native American vote does feature quite prominently in one swing state, however: Arizona, whose Native reservations are split between various counties. These counties broadly seem unlikely to repeat another large swing left, as the Native vote is already very Democratic, but turnout and raw votes matter considerably here.
Counties that shifted more Democratic in 2016 & more Republican in 2020.

There are substantially fewer counties that fall under this metric, reflecting Biden’s broad improvement over Clinton in much of the country. This category can be broadly divided into two categories: Non-Metropolitan Mormon regions, and the Hispanic South.
The Hispanic South
The counties that fall under this category all lie in the South or Southwest, and include some relatively famous names, like Florida’s Miami-Dade County.
In 2016, the conventional wisdom was that Trump’s rhetoric on Hispanics and immigration would drive Democrats to even higher numbers with Hispanics. This failed to manifest itself to the extent Democrats would have liked, but nevertheless still appeared in some areas, albeit somewhat unevenly. Some of this effect may be attributable to an increase in the Hispanic share of the electorate.
Trump’s alienation of Cubans, a Hispanic demographic that had long been friendly to Republicans, led to a landslide loss in Miami-Dade County. This would prove to be the exception, rather than a new rule. Throughout his presidency, Trump heavily courted the Cuban vote, along with other socialist-wary immigrant groups, and was rewarded with massive swings toward him in 2020. This dynamic pushed Florida, once the epitome of a swing state, further into the Republican column.
Meanwhile, Trump did fall further in some heavily Hispanic counties near the Mexican border. Notably, this list does not include South Texas counties like Zapata or Starr, where Trump improved relative to Romney — perhaps an early sign of what was to come. Kenedy County is the sole exception, but with a population of 350, few conclusions can be made.
Clinton saw gains in rural border counties like Santa Cruz County, Arizona, or Imperial County, California. Additionally, she also improved over Obama in urban centers like El Paso County, Texas, or Los Angeles County, California. Only one of these counties sports an above-average college education rate – massive Los Angeles County, which has a highly educated white population that helped drive its leftward shift in 2016.
Biden’s losses with Hispanics in 2020, in particular rural ones close to the border, translated into significant rightward swings in these counties. However, it is worth distinguishing between various Hispanic groups. Cubans, Venezuelans, and other Latin American diaspora in South Florida behaved somewhat differently than Tejanos in South Texas or Hispanic voters in more urban centers like El Paso. The divergence of these various groups have ensured that the electoral fates of Arizona and Florida now look quite different. Hispanic voters in this part of the country are quite powerful electorally, making up a significant portion of the electorate in states like Florida, Texas, Nevada, and Arizona, and this dynamic will likely cause Hispanics at large to be heavily courted by both campaigns.
The Non-Metropolitan Mormons
In 2016, Trump alienated a significant number of Mormon voters, a group concentrated in Utah and Idaho. This caused a sharp decline in Republican margins with this historically conservative group, especially because Mitt Romney, a Mormon himself, had been particularly appealing to this demographic in 2012. Additionally, a large number of Mormons opted for independent candidate Evan McMullin over either major party candidate.
Trump ended up receiving 46% of the vote in Utah, down from Romney’s 73%. This titanic drop guaranteed that many counties would see gargantuan shifts to the left. In 2020, however, Mormons were far more stable, with the third-party vote dropping to normal levels. Exit polls suggested that Utahns who voted for neither Clinton nor Trump in 2016 broke 49–39 for Trump in 2020.
However, a notable divide appeared between Utah’s educated metropolitan counties and the rurals elsewhere in the state and in Idaho. The metropolitan counties generally saw similar gains for both parties. By contrast, the rural counties generally saw Trump make substantially larger improvements on his 2016 performance than Biden did over Clinton. In Utah County, home to Provo, Trump rose from 50% in 2016 to 67% in 2020, while Biden rose from Clinton’s 14% to 26%. Meanwhile, in rural Juab County, Biden’s 11% was essentially even with Clinton’s 10%, while Trump spiked from 67% to 87%.
This fall, it is unlikely that either campaign will contest Utah or Idaho, which are both safely Republican states. Nevertheless, the Mormon vote is still very much present, albeit significantly smaller, in Nevada and Arizona. There remain signs that traditionally conservative Mormons are still not entirely comfortable with the presumptive nominee, as evidenced by Trump’s relatively narrow 56-43% win over Nikki Haley in the Utah caucuses. These caucuses saw Haley run significantly stronger in Utah’s educated metropolitan counties, even as she got blown out in the rurals, reflecting the same divisions discussed above.
Methodological Notes.
- In Utah, swing was calculated excluding third party performances. For example: in 2016, Utah County broke 50% Trump, 14% Clinton, and 30% McMullin. This is considered to be a Trump +36 county (his margin over Clinton) rather than Trump +20 (his margin over McMullin) for consistency in comparisons to 2020.
- Not all counties neatly fit into every category; each category is meant to simply give a broad overview of counties with similar traits.
- Alaska does not report election results by county/borough, instead relying on state house districts. This makes comparisons between election results and census data difficult, and consequently it is excluded from this analysis.
- A list of counties and their classifications can be found here
I am an analyst specializing in elections and demography, as well as a student studying political science, sociology, and data science at Vanderbilt University. I use election data to make maps and graphics. In my spare time, you can usually find me somewhere on the Chesapeake Bay. You can find me at @maxtmcc on Twitter.