Over the last several years, we’ve devoted hundreds (if not thousands) of hours to quantitatively modeling candidate quality and creating robust baselines to assess candidate performance via our Wins Above Replacement (WAR) models. This is because we want to have hard numbers underpinning our discussions, especially given that candidate quality conjectures almost always lie in the abstract and can frequently veer into the unsubstantiated.
I’d like to say our models are good. They certainly do something nobody has really managed to do before, at least in the public domain. But they can always get better, and so we’re always looking to improve them.
That’s why this year, as we were building our 2024 WAR models, I realized that our older ones had one big area of improvement we could address. These models didn’t account for state-specific environments nearly as well as they should have, which led to some candidates being judged under a national lens that may not have been suited for their specific race.
Most of the findings remained the same — any model worth its salt can tell you that Mark Kelly and Raphael Warnock were overperformers. But there were a few meaningful changes that came about as a result of our new and improved modeling techniques, and I think the best example I can give you is Wisconsin’s 2022 Senate election, which Ron Johnson won by 1% against Mandela Barnes. Our prior WAR model had an R+5 baseline for this race, which meant Barnes’ 1% loss was scored as a 4-point Democratic overperformance.
This doesn’t really make sense, though, if you know the context of what happened in Wisconsin. Tony Evers won by nearly 4% on the same ballot, with an electorate that Nate Cohn modeled as being Biden +1.8 by 2020 vote. Under this lens, it would be quite unreasonable to expect Ron Johnson to win by 5% — a crossover vote that large would be Amy Klobuchar-esque, and certainly shouldn’t be the baseline expectation.
Our new model learns from the state-level environments in a much more controlled and targeted fashion. Through a combination of demographics and generic ballot context, it recognizes that Democrats in Wisconsin broadly did extremely well across the board — and it correctly infers that this is because of a bluer statewide electorate than other states experienced, at least relative to 2020 vote. That’s why the new model believes that a fairer expectation for Johnson was to win by 1.4% (which is more in line with the standard incumbency boost), and that makes the new WAR for the 2022 Wisconsin Senate race D+0.4.
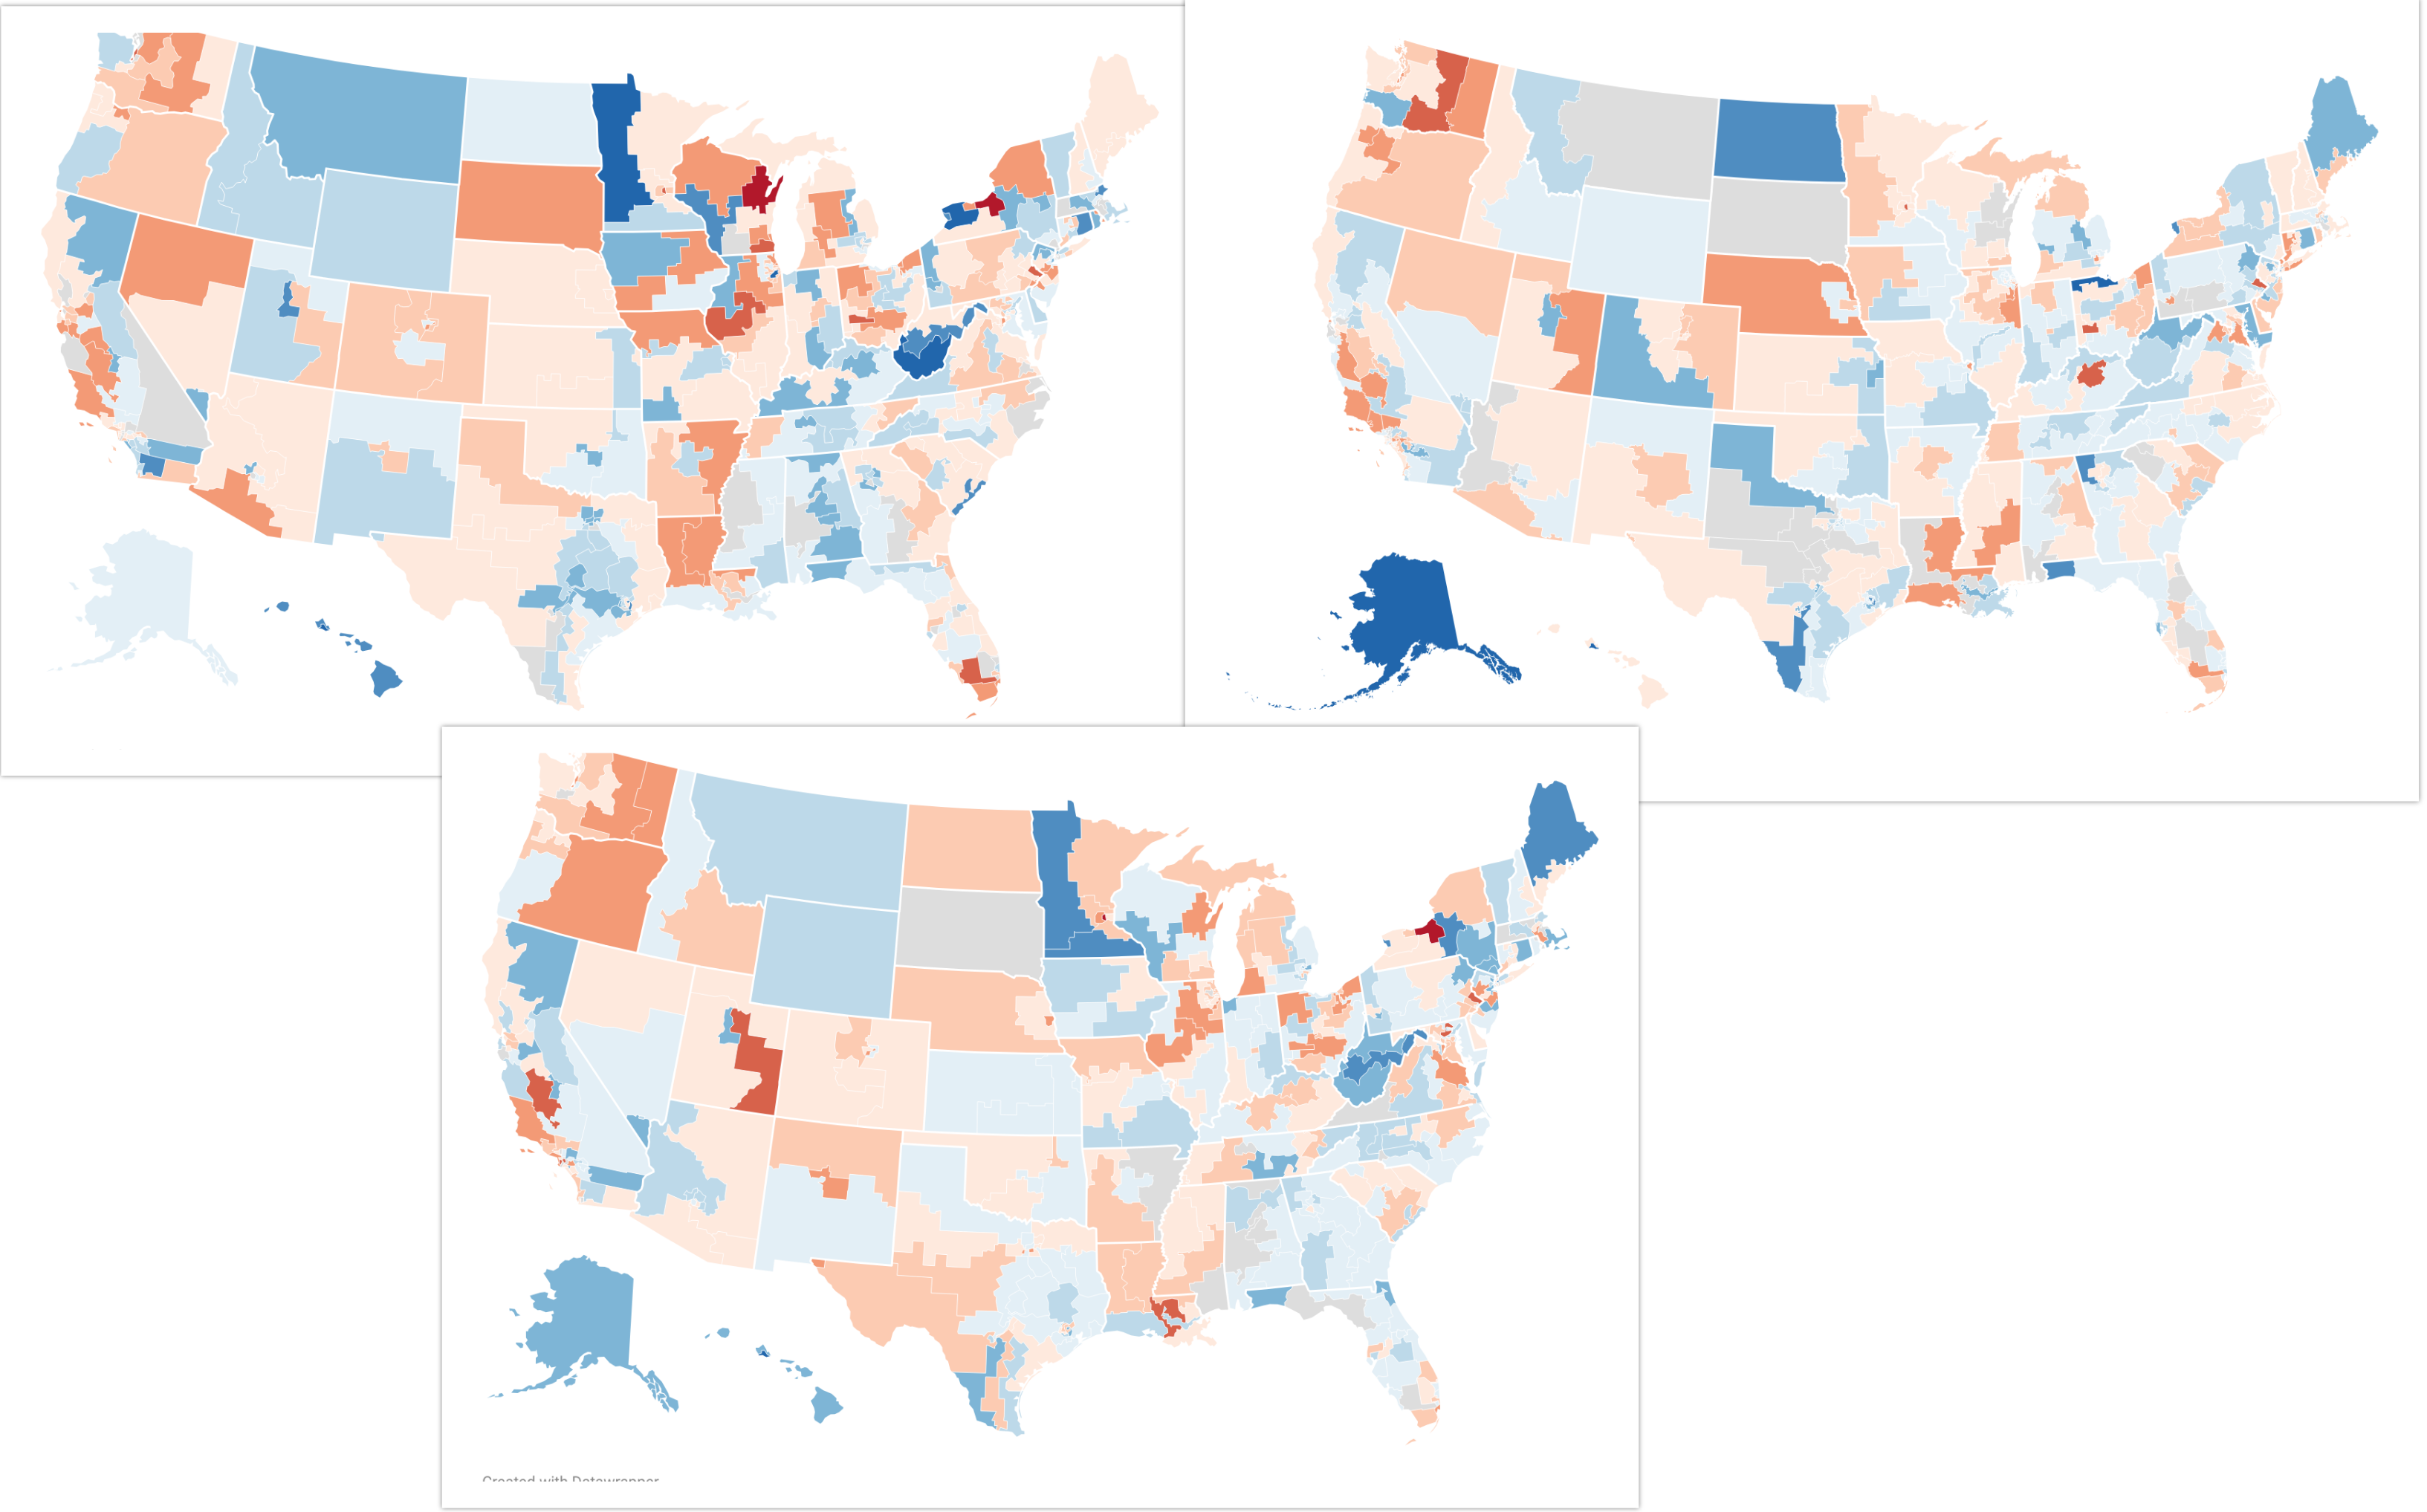
Our 2018, 2020, and 2022 models have received a refresh with this new methodology, which also brings them more in line with how our 2024 models work. For convenience, you can find them all linked below.
If you find anything interesting, noteworthy, or surprising, feel free to drop any of us an email or a Twitter DM — you can find our information on the About Us page. We’d also be remiss if we didn’t thank Ethan Chen for his help in being such a valuable sounding board for this project.
Modeling candidate quality remains one of the hardest tasks any of us have ever come across. In many ways, it’s significantly more difficult than building a forecast, due to how difficult it is to scrape and gather data, and the lack of a true “baseline” source of truth. But we hope you get some value out of these, and we remain committed to constantly improving on our models as we learn more.
I’m a computer scientist who has an interest in machine learning, politics, and electoral data. I’m a cofounder and partner at Split Ticket and make many kinds of election models. I graduated from UC Berkeley and work as a software & AI engineer. You can contact me at lakshya@splitticket.org