
INTRODUCTION
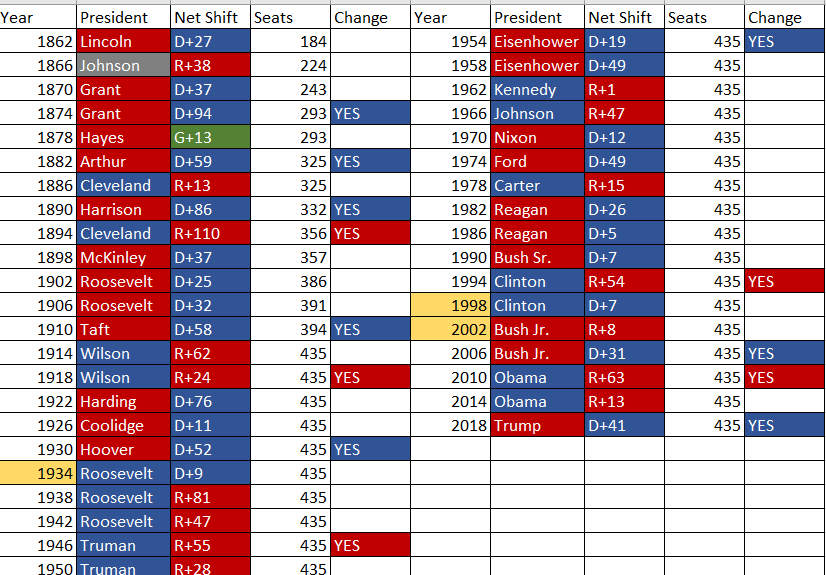
At the beginning of the 2022 cycle, one political truism benefited Republicans above all else: the out party had gained ground in all but three midterms since 1862. During that time frame, the House of Representatives had changed hands in 13 such cycles, with the presidential party often suffering double-digit losses. The GOP did not just have history on its side, though. President Biden’s lagging approval ratings, Republican momentum in generic ballot polling averages, and respectable 2021 election results all contributed to the pundit narrative that Democrats would be doomed in November.
Forecasting sentiment still pointed to a Republican victory driven by undecided voters even after the June Dobbs v. Jackson decision galvanized the pro-choice Democratic base, helping the White House party overperform in multiple fall House special elections. Many expected Dobbs to stave off a 2010-level disaster for Democrats, but few thought it would be impactful enough to match President Clinton’s impeachment or the 9/11 attacks, which allowed the President’s party to gain ground overall in 1998 and 2002.
In most states, though, Democrats performed well across the board. While Republicans predictably flipped the House, swing-district Democrats generally overcame Biden’s 41% approval rating, which was lower than Obama’s in November 2010, and held the GOP to a slim 222-seat majority. Democrats also made net gains in gubernatorial and senatorial elections, becoming the first White House party since 1934 to do so. All told, it’s clear that 2022 was an exceptional midterm in which the out party wave narrative collapsed.
GENERIC BALLOT EXPECTATIONS
Though it was not a model or official forecast, our generic ballot polling average proved to be a useful and accurate tool. Designed to eliminate biases caused by partisan polling, which “flooded the zone” with illusory Republican momentum in the two weeks leading up to the election, the tracker’s final update showed a D+0.2 generic ballot. 538, for comparison, predicted an R+1.2 lead. To us, this highlighted disagreement between different pollsters on what the national picture would actually look like. Polls like NBC’s, for example, suggested a D+1 environment, while Quinnipiac forecast R+4.
While our aggregator was only a tracker, not a forecast, the stark divergence between polling conducted by nonpartisan and partisan firms suggested that there was a real danger to uncritically regurgitating expectations of a red wave. Our methodology actually indicated a close national environment rather than a wave, with substantial variance possible. That’s partly why our forecasts ended up being so accurate – we projected 34 out of 35 senate races, 34 out of 36 gubernatorial elections, and 95% of House races correctly.
ANALYZING THE RESULTS
Methodology
Our national environment calculation is an average of the generic ballot determined for each state using bipartisan-contested districts — seats in which Democratic and Republican nominees were on the ballot — and uncontested district estimates. To project how seats without two major party candidates might have voted had they been properly contested this year, we shifted the raw 2020 presidential vote based on the average swing for each state’s bipartisan-contested districts and decreased voter turnout. For at-large districts, we used the “top-of-the-ticket” turnout and substituted the shift in afterwards.
Conclusions
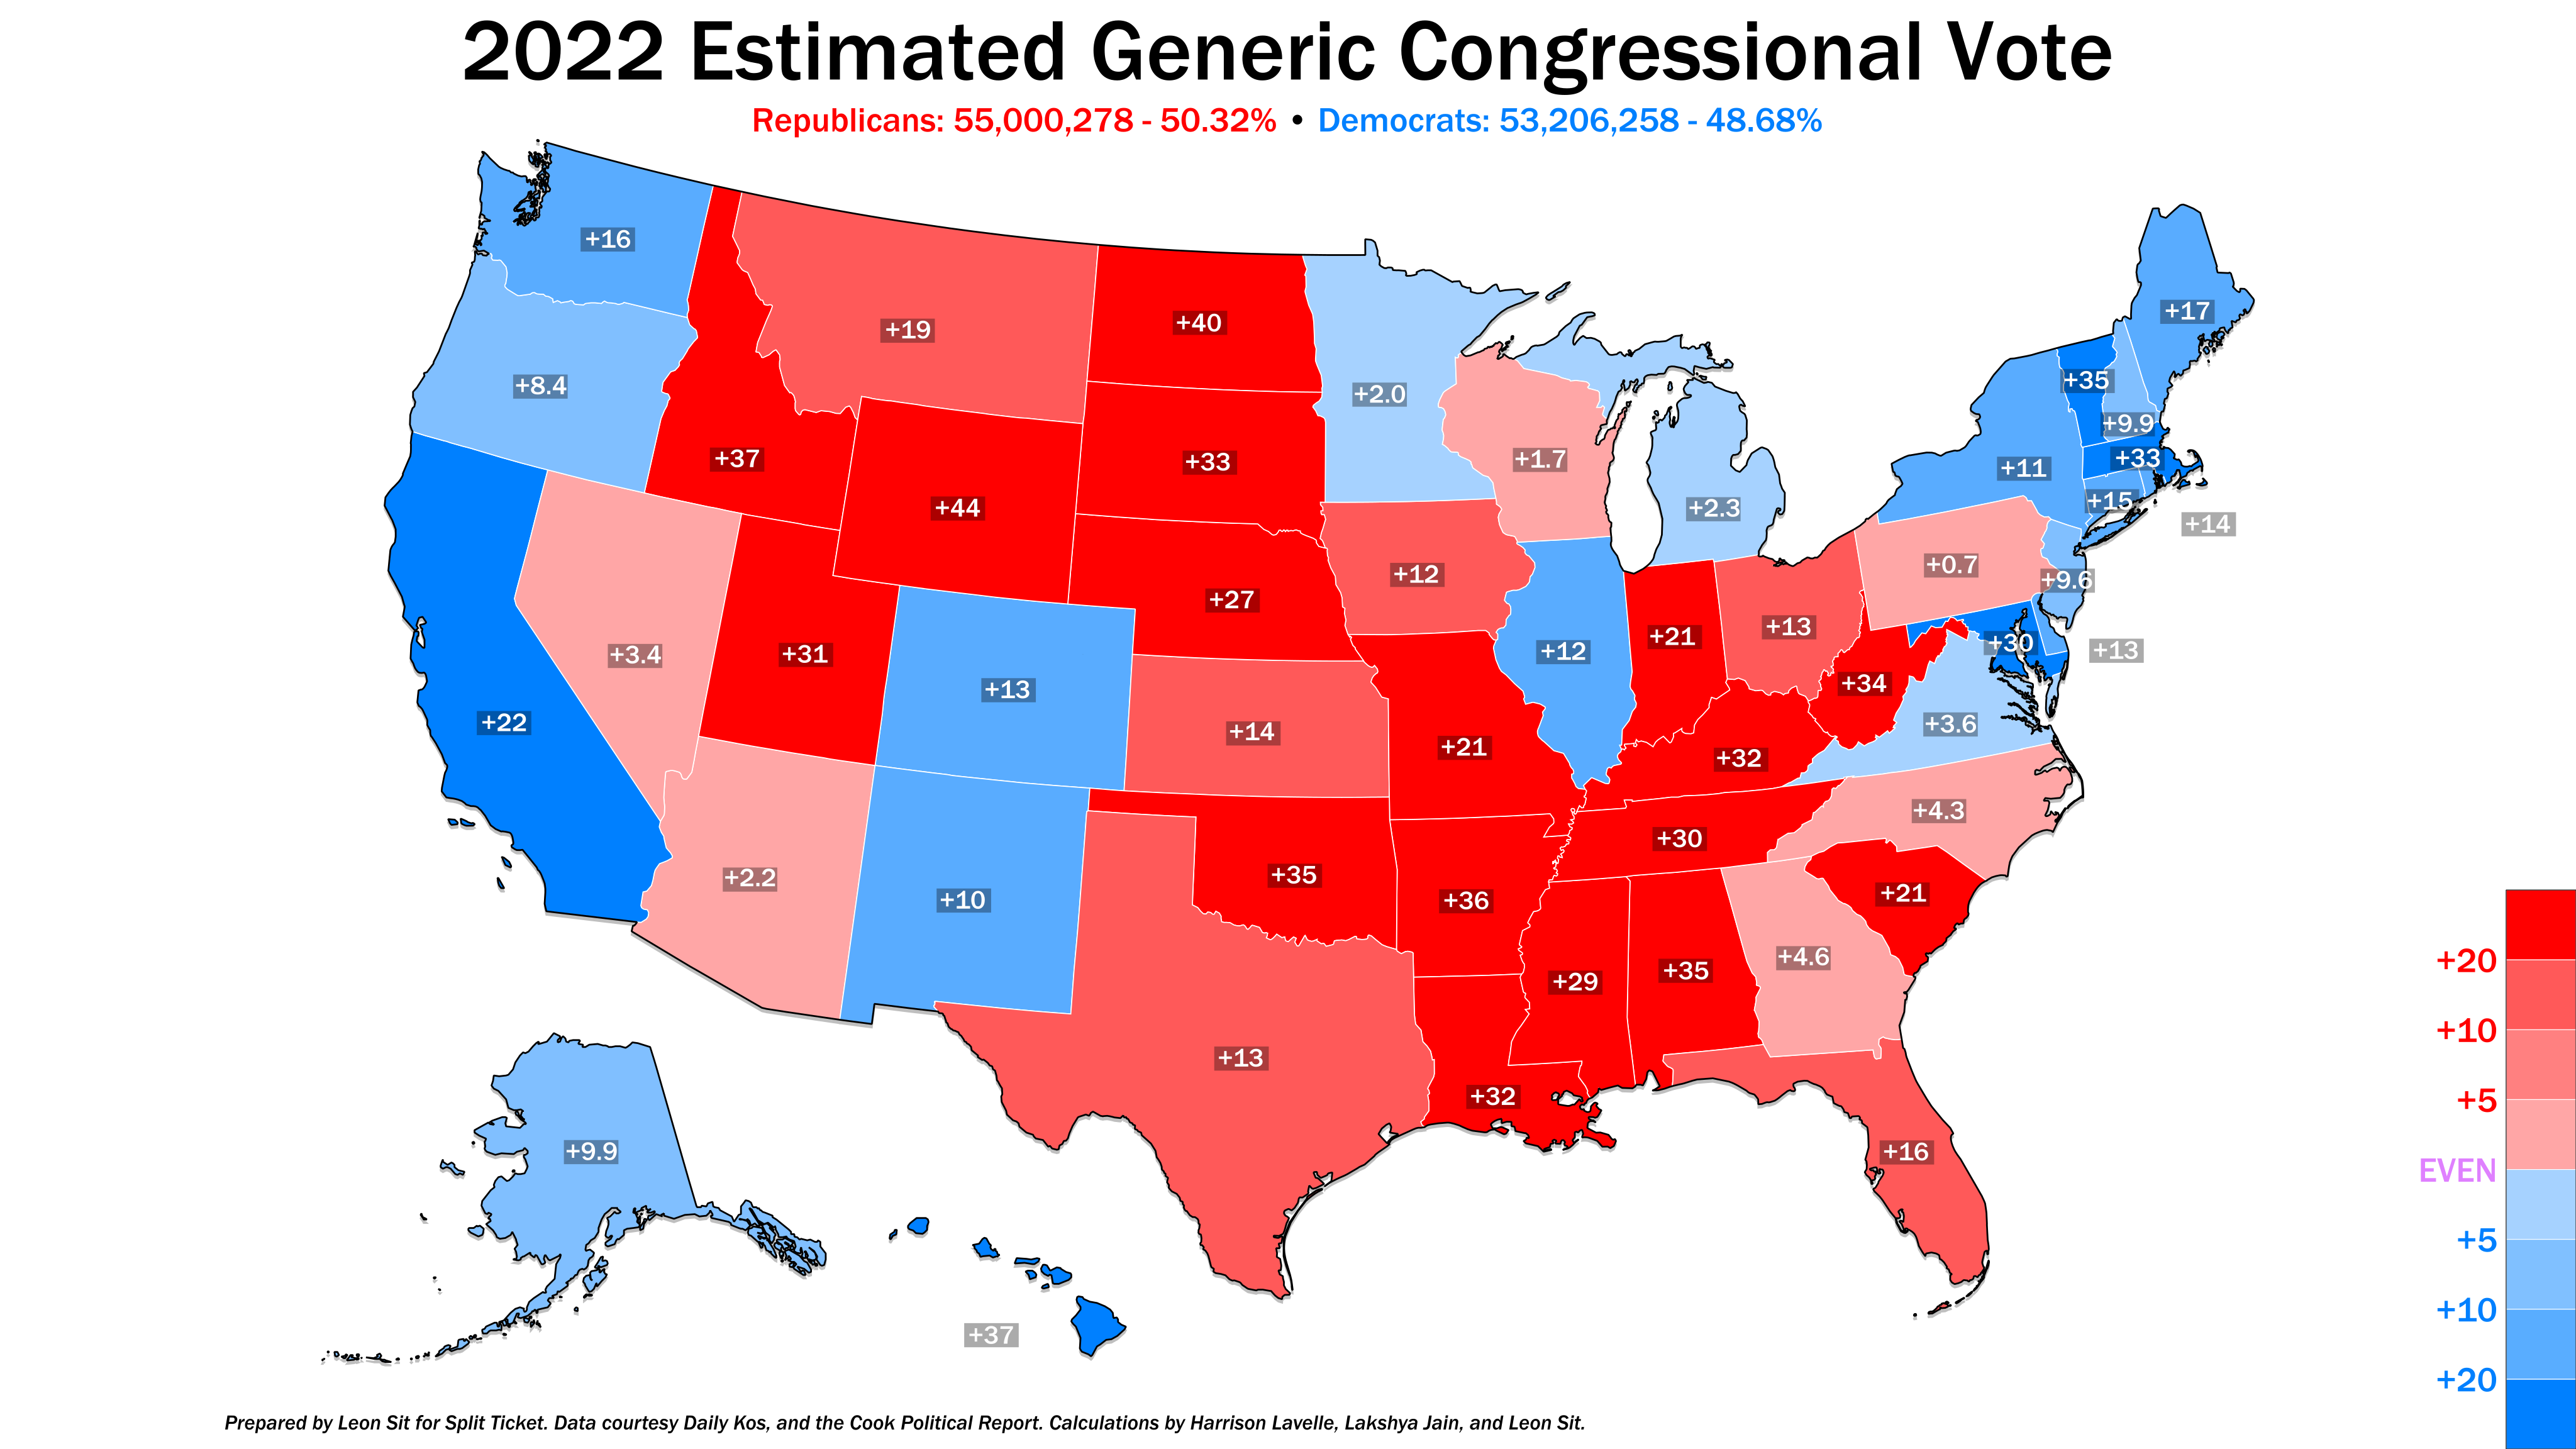
Split Ticket’s calculations showed an R+1.6 national generic ballot after accounting for uncontested seats, most of which were won by Republican candidates this year. That figure is slightly less than the apparent R+2.8 House popular vote, proving that Tuesday’s national environment was indeed only Republican-leaning. Given the heavy state-by-state variations in swings relative to the national average, i.e., Democrats having a banner night in Colorado while struggling badly in Florida, we suggest analyzing the generic ballot at the state level. You can find our full calculation sheet for all fifty here.
Statewide Races

When it comes to how the nation’s competitive gubernatorial and senatorial races turned out relative to each state’s generic ballot, one theme stood out: poor candidate quality cost Republicans multiple winnable races. One clear example was Arizona, which had an R+2.2 generic ballot estimate thanks to the victories of swing seat Republicans David Schweikert (AZ-01) and Juan Ciscomani (AZ-06). Despite that favorable figure, Democrats won 4 of the Grand Canyon State’s 5 statewide elections. Controversial GOP nominees Blake Masters (Senate) and Kari Lake (Governor) underperformed the calculated generic ballot by 7.1 and 2.8 points respectively.
Colorado, Nevada, and Wisconsin turned out similarly. In the Centennial State, GOP gubernatorial candidate Heidi Ganahl underperformed the D+12.7 generic ballot estimate by 6.6, highlighting the popularity of Governor Jared Polis. Senate nominee Joe O’Dea trailed the metric (by 1.9) despite distancing himself from former President Trump on the campaign trail.
Although they led the generic ballot in both Nevada and Wisconsin, Republicans underperformed in both states. The Silver State had an R+3.4 estimated generic ballot, likely inflated by higher turnout in Republican Mark Amodei’s seat (NV-02) relative to low Clark County Hispanic participation. We still consider it instructive of the candidate quality delta between Governor-elect Joe Lombardo, who underperformed it by 1.9, and losing Senate nominee Adam Laxalt, who ran behind the metric by 4.2 points.
In the Badger State, unpopular Republican Senator Ron Johnson squeaked by Lt. Gov. Mandela Barnes to win reelection. Johnson, who underperformed in 2016 according to Split Ticket WAR research, also ran behind Wisconsin’s R+1.7 generic ballot estimate by 0.7 points this cycle. Republican gubernatorial nominee Tim Michels struggled more, underperforming the expectation for a generic Republican by 5.1 against Democratic Governor Tony Evers.
Michigan and Pennsylvania both had close generic votes (D+2.3 and R+0.7) and should theoretically have been winnable for Republicans with enough moderate branding and crossover appeal. Republicans Tudor Dixon (MI) and Doug Mastriano (PA), two of this cycle’s lowest-quality gubernatorial candidates, underperformed their generic state performance estimates by 8.2 and 15.4 points, respectively. Meanwhile, Mehmet Oz, our pre-election pick in the Keystone State’s Senate election, ran behind Pennsylvania’s metric by 5.6 in his convincing loss to Lt. Gov. John Fetterman.
Other states — like Georgia, Kansas, New Hampshire, New York, Ohio, and Oregon — witnessed significant deltas between their gubernatorial and senatorial contests thanks to incumbency-driven candidate quality effects. In the Peach State, for example, Republican Governor Brian Kemp won reelection and outperformed Georgia’s R+4.6 generic ballot lean by 2.9 points. Senate candidate Herschel Walker, struggling to come remotely close to Kemp’s numbers in the Atlanta Metro, underperformed by 7.3 — making him the GOP’s worst swing-state Senate candidate by our metric.
The divide was starkest in Kansas, a reliably-red state where Democratic Governor Laura Kelly and Republican Senator Jim Moran both won reelection. Democratic Congresswoman Sharice Davids’s comfortable win (KS-03) helped lower the generic ballot margin to R+14.4, but Republican gubernatorial nominee Derek Schmidt still underperformed the metric by 16.5 — placing him behind even Mastriano. Moran, by comparison, outran the estimate by 8.8 points.
New Hampshire’s Republican Governor Chris Sununu found himself in a similar position, outrunning the Granite State’s generic ballot estimate by almost 25 points more than Senate nominee Don Bolduc. Ohio Governor Mike DeWine mirrored this dynamic, surpassing an R+12.9 generic ballot by 12.2; J.D. Vance underperformed the same figure by 6.7 points.
In New York and Oregon, Democrats won both gubernatorial races but lagged behind the generic ballot estimate relative to their Senate nominees. Republicans Lee Zeldin (NY) and Christine Drazan (OR) both beat their state’s generic ballot by 5 points, almost certainly helping House Republicans down-ballot. Senators Chuck Schumer (NY) and Ron Wyden (OR), both veteran Democrats facing weak challengers, likewise had little issue outrunning their state’s generic vote.

FINAL THOUGHTS
Our in-house generic ballot calculations offer a look at the political environment in each state relative to the Republican-leaning national picture, showing readers where weak statewide candidates may have cost the GOP winnable races. The next installment in this analysis series will take a retrospective look at the 2020 generic ballot to see how each state swung relative to our 2022 calculations.
Author’s Note
This index was updated on January 19th, 2023 to reflect the certified 2022 House election results.
My name is Harrison Lavelle and I am a political analyst studying political science and international studies at the College of New Jersey. As a co-founder and partner at Split Ticket, I coordinate our House coverage. I write about a variety of electoral topics and produce political maps. Besides elections, my hobbies include music, history, language, aviation, and fitness.
Contact me at @HWLavelleMaps or harrisonwlavelle1@gmail.com
I make election maps! If you’re reading a Split Ticket article, then odds are you’ve seen one of them. I’m an engineering student at UCLA and electoral politics are a great way for me to exercise creativity away from schoolwork. I also run and love the outdoors!
You can contact me @politicsmaps on Twitter.
I’m a software engineer and a computer scientist (UC Berkeley class of 2019 BA, class of 2020 MS) who has an interest in machine learning, politics, and electoral data. I’m a partner at Split Ticket, handle our Senate races, and make many kinds of electoral models.